
If you’ve ever taken the Yale Food Addiction Scale questionnaire, [1] a 35-item questionnaire whose answers are scored into eleven symptom criteria, asking things like whether you’ve tried and failed to cut down on or stop eating certain foods, or whether you’ve had problems with family or friends because of how much you overate, there’s a reasonable assumption sitting underneath it. It is a research and screening instrument rather than a diagnostic one, and “food addiction” is not itself a standalone diagnosis in the DSM framework the scale’s eleven criteria were adapted from, so a symptom count is a description of what you endorsed, not a verdict on what you have. The assumption is that the test measures one thing: an addictive relationship with food, the same way a substance-use questionnaire measures an addictive relationship with alcohol or nicotine. Score higher, the logic goes, and you have more of that thing. And because people in larger bodies tend to score higher on average, it’s tempting to read the whole scale as a single, uniform signal of “how addicted are you to food,” with body weight simply riding along as the visible consequence.
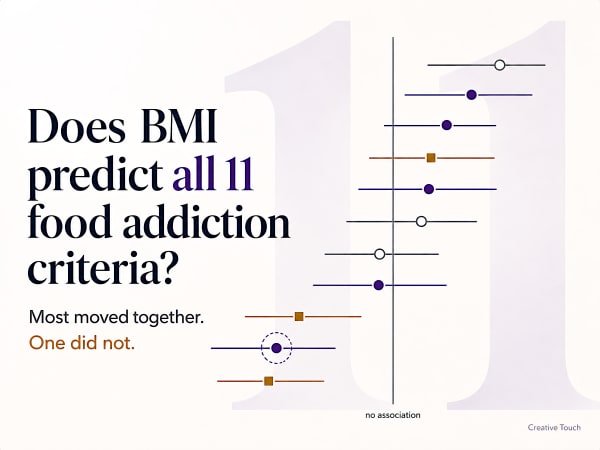
We wanted to know whether that assumption holds up criterion by criterion, not just as a total score. Specifically: does body mass index (BMI) predict all eleven parts of this questionnaire equally, or does it load more heavily onto the questions whose content is already entangled with what it’s like to live in a larger body: your family or friends being worried about how much you eat, giving up other important activities because of your eating, or continuing to eat foods you knew were physically dangerous given a health condition you already had? We pre-specified which five criteria would carry more of that signal and which three wouldn’t, before we ran a single test.
The short answer is: the link is real, but it isn’t where we expected it to be, not entirely. Our headline test passed. But the criterion that was supposed to be one of the clearest examples of the pattern we predicted, the one about giving up activities because of eating, ran significantly in the opposite direction. We think that’s more interesting, and more useful to report, than a clean confirmation would have been, and this piece walks through why.
How we tested this
This was run as a pre-specified analysis, not an exploratory dig, though we want to be precise about what that means here. Pre-registration, in the strict sense used in clinical trials, means depositing an analysis plan with an independent third party, such as a public registry, before the analysis is run, so that someone other than the researchers can vouch for the timing. We didn’t do that, and we’re not going to describe this study as pre-registered. What we did instead: we wrote the full statistical analysis plan, including the hypothesis, the exact statistical model and the rule for handling multiple comparisons, and committed it to version control before any model was fitted or any p-value inspected. That plan is published in full, as it was written, with its deviations log and without later tidying.
The analysis itself was run afterwards, in a separate committed script, against a frozen sample: every response submitted to Creative Touch’s free online food addiction quiz up to 25 July 2026, with no later submissions able to affect the result and no possibility of the freeze date being adjusted after the fact. The ordering is genuine. But the repository was private, with no external remote, and a commit timestamp is something the person making the commit controls, not an independent record. We’d use a public registry next time. Until then, take this as the discipline it is, not the credential it isn’t.
After excluding respondents under 18 (a bright-line research-ethics decision, not a statistical one; an unsupervised online quiz has no route to parental consent), screening out a handful of biologically implausible height/weight combinations, and requiring BMI, age band and sex to all be recorded, the descriptive analytic sample was 1,796 respondents. The primary confirmatory model, which additionally excludes the small number of respondents recording sex as “other” or “prefer not to say” for power reasons, ran on 1,773 respondents (14,184 stacked rows, since each respondent contributes one row per criterion in the primary design). Roughly 77% of respondents were female, and the sample skewed toward the US and UK. This is a self-selected group of people who chose to take a food addiction quiz online, not a population sample, and that matters for how far the findings generalise (see limitations, below).
Why we couldn’t just compare the eleven questions directly
Before the result, it’s worth explaining why the obvious approach, checking whether BMI predicts each of the eleven criteria and then seeing which ones show the strongest link, would have been close to meaningless. This is the single most useful thing this study has to offer anyone reading a health questionnaire critically, food-related or otherwise, so it’s worth sitting with.
Every one of the eleven criteria is a component of the same total score, and that total score is already known to track body weight. Creative Touch’s own live analytics show mean symptom count rising from 3.38 at a normal BMI to 6.85 in the highest obesity band. One caveat on that figure, which we explain in full further down: that total score includes criterion 7, and criterion 7 turns out to have been measured incorrectly for reasons unconnected to this specific analysis. Roughly a fifth of its positives come from a non-withdrawal item that’s itself strongly linked to BMI, so this gradient is very likely slightly overstated, in that specific direction, by an amount we haven’t attempted to quantify. It is not in doubt as a gradient. One criterion out of eleven, partly affected, doesn’t produce or reverse a rise from 3.38 to 6.85.
Run all eleven criteria against BMI on their own, without any adjustment, and the picture looks dramatic: all eleven show a positive association with BMI, and all eleven are statistically significant at p < 0.05, several with p-values so small they carry more than twenty zeroes after the decimal point. Criterion 2 (persistent desire to cut down, or repeated failed attempts to do so) shows an unconditioned odds ratio of 1.614 per 5 BMI units; criterion 10 (use in physically hazardous situations, such as continuing to eat foods known to be dangerous given an existing health condition, or being so distracted by food that you could have been hurt, for example whilst driving) shows 1.442; criterion 1 (eating larger amounts or for longer than intended) shows 1.399, at p = 3.4 × 10⁻²², about as small as p-values get in social science data.
That looks like overwhelming, uniform evidence. It isn’t evidence of anything specific at all. Every criterion shows a positive BMI association for the trivial reason that BMI predicts overall symptom severity, and overall severity mechanically drags every one of its own components upward. Comparing eleven numbers that are all inflated by the same underlying mechanism doesn’t tell you which criteria are distinctively linked to body weight. It just re-proves, eleven times over, something we already knew from the total score.
So we conditioned. For each criterion, we built a model that asks a sharper question: among people who are equally symptomatic overall, measured as their total score on the other ten criteria, so the outcome is never inside its own predictor, does BMI still predict whether they endorse this particular one? That single adjustment changes the picture completely. Once overall severity is held constant, criterion 1’s odds ratio collapses from 1.399 (p = 3.4 × 10⁻²²) to 1.014 (p = 0.71). An association with a p-value carrying twenty-one zeroes after the decimal point evaporates entirely, not because the earlier finding was wrong or fraudulent, but because it was answering a different question than the one that matters. Comparable shifts, in the region of +0.25 to +0.42 in odds-ratio terms, appear across all eleven criteria once conditioning is applied. This is the circularity problem our statistical plan was designed around, demonstrated with real numbers rather than just argued for on paper.
Show these figures as a table
| Criterion | Unconditioned OR | Conditioned OR | Shift |
|---|---|---|---|
| C2 failed cut-down | 1.614 | 1.205 | −0.410 |
| C5 use despite harm | 1.523 | 1.112 | −0.412 |
| C7 withdrawal | 1.501 | 1.085 | −0.416 |
| C10 hazardous use | 1.442 | 1.187 | −0.255 |
| C3 time spent | 1.433 | 1.075 | −0.358 |
| C8 interpersonal | 1.405 | 1.084 | −0.321 |
| C1 larger amounts | 1.399 | 1.014 | −0.385 |
| C9 role failure | 1.312 | 0.998 | −0.314 |
| C6 tolerance | 1.286 | 0.912 | −0.374 |
| C11 craving | 1.269 | 0.870 | −0.399 |
| C4 activities given up | 1.244 | 0.875 | −0.368 |
The headline result, and the criterion that broke rank
With conditioning in place, our primary, pre-specified test compared two groups of criteria. The first, the content-confounded set, covers questions whose wording plausibly overlaps with the lived experience of being in a larger body, independent of any addictive process: giving up activities because of eating (criterion 4), continuing to eat despite knowing it was causing harm (criterion 5), interpersonal problems caused by how much you eat (criterion 8), failing to fulfil role obligations because of overeating (criterion 9), and hazardous use (criterion 10). The second, the pharmacological core, covers tolerance (criterion 6), withdrawal (criterion 7) and craving (criterion 11): the criteria that map most directly onto the biological mechanics of addiction, with the least obvious overlap with body-size stigma or its social consequences.
| Criterion | Endorsed by | Odds ratio per 5 BMI units (95% CI) | q | |
|---|---|---|---|---|
| Content-confounded (hypothesised stronger BMI association) | ||||
| 4 | Important activities given up because of eating | 33.2% | 0.875 (0.812–0.944) | 0.0014 |
| 5 | Continued eating despite knowing it was causing harm | 50.8% | 1.112 (1.031–1.199) | 0.0132 |
| 8 | Interpersonal problems caused by how much you eat | 28.6% | 1.084 (0.997–1.178) | 0.0794 |
| 9 | Failure to fulfil role obligations because of overeating | 28.9% | 0.998 (0.922–1.079) | 0.9519 |
| 10 | Hazardous use (eating when it was physically dangerous) | 33.9% | 1.187 (1.087–1.296) | 0.0005 |
| Pharmacological core (hypothesised weaker) | ||||
| 6 | Tolerance (needing more for the same effect) | 34.5% | 0.912 (0.846–0.983) | 0.0288 |
| 7 † | Withdrawal | 56.4% | 1.085 (1.008–1.169) | 0.0481 |
| 11 | Craving | 42.8% | 0.870 (0.812–0.933) | 0.0005 |
| Neither set (reported for transparency, not adjudicating the hypothesis) | ||||
| 1 | Ate larger amounts, or for longer, than intended | 53.3% | 1.014 (0.940–1.095) | 0.7852 |
| 2 | Persistent desire, or repeated failed attempts, to cut down | 56.9% | 1.205 (1.112–1.306) | < 0.0001 |
| 3 | A great deal of time spent obtaining, eating or recovering | 44.3% | 1.075 (0.995–1.161) | 0.0814 |
Our prediction was that BMI would predict the content-confounded criteria more strongly than the pharmacological-core criteria, even after conditioning on overall severity. That prediction held, under the primary model exactly as it was written down in advance. The content-confounded slope came out at OR 1.0608 per 5 BMI units; the pharmacological-core slope at OR 0.9764. The confirmatory test, a single, pre-specified contrast between the two, with no multiplicity correction because it was the one test the whole design was built around, gave a ratio of odds ratios of 1.0864 (95% CI 1.0253–1.1510, z = 2.8086, p = 0.0050), on n = 1,773 respondents across 14,184 stacked rows. One test, one p-value, exactly as specified in advance. H1 passed.
That is the headline. Here is the part that has to sit in the same breath as it, not several paragraphs later: the pattern underneath that headline number is considerably messier than that single number suggests, and one of the five criteria we predicted would run one way ran significantly the other way instead. Criterion 4, activities given up because of eating, was one of our clearest hypothesised examples of a content-confounded criterion. Looked at on its own fitted slope, rather than folded into the set-level average, it showed an odds ratio of 0.875 (95% CI 0.812–0.944, q = 0.0014 after correcting for multiple comparisons), meaning higher BMI was significantly less likely to predict endorsing this criterion at equal overall severity, not more. Criterion 7 (withdrawal), on the pharmacological-core side, also ran counter to its own set’s direction: OR 1.085 (95% CI 1.008–1.169, q = 0.048). We have to flag that number immediately rather than let it sit unqualified: after this analysis was run, we found that criterion 7 had been measured incorrectly for the calculator’s entire seventeen-month life. That result can no longer stand as clean evidence, for reasons the next section explains in full, and criterion 4 is now this study’s central counter-finding. Criterion 9 (role failure) also pointed the “wrong” way but was statistically indistinguishable from no effect at all (OR 0.998, q = 0.952).
Add it up and the set-level averages hide real internal disagreement: only 3 of the 5 content-confounded criteria sit above an odds ratio of 1 (spread across the set: 0.875 to 1.187), and only 1 of the 3 pharmacological-core criteria does (spread: 0.870 to 1.085, though that upper figure is criterion 7’s compromised result, not a clean one, for reasons the next section sets out). Much of the overall contrast is being pulled by criteria 6 and 11 (tolerance and craving) dragging the “core” side down, rather than by the content-confounded criteria uniformly rising. A summary that reports 1.0864 and stops there would leave a reader believing every content-confounded criterion behaved as predicted. Only three of the five did, and criterion 4 broke rank at a level that survives correction for multiple testing. That nuance is the actual finding here, not an asterisk on it.
Show these figures as a table
| Criterion | Set | OR per 5 BMI units | 95% CI | q (BH) |
|---|---|---|---|---|
| C2 failed cut-down | Neither set | 1.205 | 1.112–1.306 | < 0.0001 |
| C10 hazardous use | Content-confounded | 1.187 | 1.087–1.296 | 0.0005 |
| C5 use despite harm | Content-confounded | 1.112 | 1.031–1.199 | 0.0132 |
| C7 withdrawal | Pharmacological core | 1.085 | 1.008–1.169 | 0.0481 |
| C8 interpersonal | Content-confounded | 1.084 | 0.997–1.178 | 0.0794 |
| C3 time spent | Neither set | 1.075 | 0.995–1.161 | 0.0814 |
| C1 larger amounts | Neither set | 1.014 | 0.940–1.095 | 0.7852 |
| C9 role failure | Content-confounded | 0.998 | 0.922–1.079 | 0.9519 |
| C6 tolerance | Pharmacological core | 0.912 | 0.846–0.983 | 0.0288 |
| C4 activities given up | Content-confounded | 0.875 | 0.812–0.944 | 0.0014 |
| C11 craving | Pharmacological core | 0.870 | 0.812–0.933 | 0.0005 |
One more result worth flagging on its own terms: criterion 2, persistent desire to cut down, or repeated unsuccessful attempts, turned out to be the single strongest BMI association in the entire study (OR 1.205, 95% CI 1.112–1.306, q = 0.0001), and it wasn’t part of either hypothesised set. It sat in a “neither” category, reported for transparency but never intended to adjudicate the main hypothesis. It’s a genuinely interesting number, and it’s worth being precise about what kind of evidence it is rather than waving it away. The test itself was pre-specified and multiplicity-corrected: criterion 2’s model is one of the eleven in the secondary per-criterion analysis, fitted exactly as planned and carried through the same Benjamini–Hochberg correction as the rest. What is post-hoc is singling it out, which we are only doing because it turned out to have the largest estimate. That makes its prominence here exploratory, not a separately hypothesised finding, and it is not a result we predicted or designed the study to detect.
We found a measurement defect in our own tool, and here’s exactly what it does to this result
Before you read any further, you need to know something that came to light after every number above had already been calculated and reported: the calculator that produced this dataset had been mis-scoring criterion 7, withdrawal, for its entire life.
Here’s what went wrong. The calculator’s scoring code assigns each of the eleven DSM-5-adapted criteria to a specific set of the underlying questionnaire’s items, and a criterion counts as met if any one of its assigned items crosses its own threshold. Criterion 7 should have been built from five items, one of which is the questionnaire’s genuine withdrawal item: “When I cut down on or stopped eating certain foods, I felt irritable, nervous or sad.” Instead, a single mistyped digit substituted a different item entirely: one that already belongs to criterion 1 and reads “When I started to eat certain foods, I ate much more than planned.” That’s not a withdrawal question. It’s a question about amount and duration, and it was already being counted correctly under criterion 1. Meanwhile, the real withdrawal item was scored against its own threshold and then, because of the same slipped digit, filed under no criterion at all and quietly discarded.
This has been happening since the calculator first went live on 23 February 2025, so it touches every one of the 6,105 responses in the full dataset, and, by extension, every one of the 1,796 respondents in this study. Seventeen months of results, all of them.
Here’s the size of it. In our analytic cohort, 1,012 of 1,796 respondents (56.3%) endorsed criterion 7. Of those, 191 (18.9%) were positive solely because of the misplaced item, with no genuine withdrawal content contributing anything at all (this closely matches the 686 of 3,597, 19.1%, seen across the whole frozen dataset before our study-specific exclusions). Put another way: roughly one in five of the people this study counts as showing withdrawal symptoms were flagged on a question that has nothing to do with withdrawal.
That 18.9% is not a false-positive rate, and we should not let it be read as one. It measures how many recorded criterion-7 positives depended on the misplaced item among the answers that were kept. Because the genuine withdrawal item was never stored for anyone, we cannot know how many of those 191 people would have met criterion 7 anyway, correctly, through the question that was discarded. Some of them almost certainly would have. The right description is that 18.9% of criterion-7 positives were dependent on the faulty mapping, which is a statement about the scoring, not a count of people wrongly classified.
That’s the contamination we can measure. The false-negative rate, respondents who genuinely felt irritable, nervous or sad when cutting down but weren’t captured because the real withdrawal item was never assigned to any criterion in the first place, is something we can’t measure, and never will be able to. The calculator only stores a respondent’s answers to a criterion’s items when that criterion is met. Because the genuine withdrawal item was never mapped to any criterion, its answers were never written to the database for anyone, at any point in the tool’s history. There is no archived data to go back and rescore. This isn’t a gap better analysis can close later. It’s gone.
What this means for the finding you just read: criterion 7 was one of only two criteria running significantly against its own hypothesised set’s direction, alongside criterion 4. We can no longer treat that as two clean counter-findings. Criterion 4 was scored correctly throughout, untouched by this defect, and its result stands exactly as reported: it remains this study’s central counter-finding. Criterion 7’s result is now, at best, ambiguous, and quite possibly telling us something about a mislabelled question rather than about withdrawal itself. From here on, when we say this study found a criterion running the “wrong” way, we mean criterion 4.
We logged this the moment we found it, in the study’s deviations record (statistical analysis plan, §9, Deviation 2), and we ran a sensitivity check to see what removing the contaminated criterion does to the study’s one confirmatory result. That check was added after the fact, and we need to be exact about what was and wasn’t fixed in advance, because this is precisely the distinction the rest of the article asks you to hold us to. The sensitivity analysis was not in the original plan; it could not have been, since the defect had not been discovered when the plan was written. It is recorded as post-hoc and non-confirmatory in the results file itself. What was settled before either version was fitted: which of the two would count as the primary sensitivity result, and the direction we expected the estimate to move. That ordering is worth something, but it is not pre-registration, and we are not going to call it that.
Two versions: one that simply drops criterion 7 from the pharmacological-core comparison group (n = 1,773 respondents, 12,411 rows), and one that also recalculates every respondent’s severity adjustment to exclude criterion 7 entirely (same n). Both come out higher than our pre-specified figure: 1.1440 (95% CI 1.0752–1.2171, p = 2.09 × 10⁻⁵) and 1.1455 (95% CI 1.0750–1.2206, p = 2.79 × 10⁻⁵), against the pre-specified 1.0864 (95% CI 1.0253–1.1510, p = 0.0050).
Two things about those numbers, and both need care. First, this is not evidence for our hypothesis, and we want to be direct about that because it would be easy to misread it that way. We declared, in writing, before running either version, that removing criterion 7 should push the contrast higher: criterion 7 was the only member of the pharmacological core whose own slope sat above 1, so dropping it from that side of the comparison mechanically removes the one thing that was pulling the “core” average down. Getting a higher number after doing that isn’t a discovery. It’s exactly what we said would happen, for a reason that has nothing to do with whether the underlying hypothesis is true. The pre-specified figure of 1.0864 remains this study’s headline number. We are not promoting the sensitivity analysis above it, and neither should you.
Second, the fact that both versions land close together, 1.1440 and 1.1455, a difference of 0.0015 despite more than half the sample having a recalculated adjustment term in the second version, might look like proof the defect didn’t really matter. It isn’t. Both versions simply remove criterion 7 from the analysis. Neither one measures a correctly-scored criterion 7 in its place, because that data doesn’t exist and never will. Agreement between two ways of excluding something tells you the exclusion is stable. It doesn’t tell you what a properly measured criterion 7 would have shown.
The live calculator has been fixed. It now maps criterion 7 to the correct items, including the genuine withdrawal question, and the same correction has been made everywhere the old mapping was duplicated. No historical response has been changed or re-scored: this dataset, and this study, stand exactly as they were collected, defect included, because that’s the only honest way to report on data that’s already been analysed and frozen. Anyone comparing criterion 7’s prevalence before and after the fix date should expect a step change in the numbers that has nothing to do with anything real happening in the population, and everything to do with the tool finally asking the right question.
We’re not raising any of this to soften what we found. Criterion 4’s result doesn’t need criterion 7 to stand on. It stands on its own.
A pattern that’s tempting, and that we’re not going to pretend fits
There’s an alternative way to group these eleven criteria that looks neater than the one we specified in advance: split them into things other people can see, or that involve a history of trying and failing to control eating (failed cut-down, hazardous use, use despite harm, interpersonal problems) versus private internal states nobody else witnesses (craving, tolerance). It’s a satisfying story, and if we’d built the analysis around it after seeing the results, it would look like it explained the data rather well.
It doesn’t hold up, and criterion 4 is enough to show why: activities given up is about as socially visible a criterion as this scale contains, and it sits at the bottom of the association rather than near the top. We’d ordinarily also point to criterion 7, withdrawal, as a second example: a private internal state that sits near the top of the association, the opposite pairing, which would break this alternative story a second way. We can’t use it here. As the previous section explains, criterion 7’s own measurement is compromised, so its position in this ranking isn’t clean evidence for or against anything. One clear counter-example is still enough. Any grouping constructed after the fact to fit eleven data points can always be found. That is precisely why we committed to a specific grouping in advance, rather than sorting the criteria once we already knew the answer. We’re raising this alternative pattern here, explicitly, as a question worth testing properly in a future study with its own plan fixed in advance, not as a finding of this one, and not as a replacement for the hypothesis that only partly held up.
Does a normal-weight person with a high symptom count look different from an obese person with the same count?
Our second pre-specified question was narrower and more exploratory: among people who score highly on the questionnaire overall, does the specific pattern of which criteria they endorse differ depending on whether they’re at a normal BMI or classed as obese? The idea was that a normal-weight person with a high symptom count might lean more towards the pharmacological-core criteria (craving, tolerance, withdrawal), while an obese person with an equally high count might lean more towards the content-confounded criteria.
We could not detect a difference, and the honest reason is that the study wasn’t quite large enough to rule one out. After adjusting for each group’s overall symptom load (necessary, since both groups were defined by a floor of six or more symptoms, but the obese group sits higher within that range on average, 8.69 total symptoms versus 8.36), the adjusted comparison came out at OR 0.9296 (95% CI 0.8563–1.0092, p = 0.0816). The direction matched what we predicted, but the confidence interval crosses 1, so it does not meet our pre-specified threshold for support. This is an inconclusive null, not evidence of no difference. The unadjusted, purely descriptive version of the same comparison was significant (OR 0.8693, p = 0.00073). The gap between the adjusted and unadjusted numbers is itself informative, and is exactly what the adjustment was built to catch: some of that raw difference was simply the two groups’ differing overall severity, not a true difference in criterion profile.
Two things sit behind that null and deserve disclosure rather than a footnote. First, the comparison groups shrank between when we wrote the plan and when we ran the analysis, from the planned 182 normal-weight/407 obese respondents to the real cohort’s 155 and 394, which means our achieved statistical power against a 12-percentage-point difference was 0.7533, below the 0.80 the original design assumed. A study built to detect an effect at 80% power and running at 75% is meaningfully less able to rule a real effect out, and that should sit alongside the null result, not be discovered later by a sceptical reader doing their own maths.
Show the underlying values
| Contrast | Odds ratio | 95% CI | p | Working correlation |
|---|---|---|---|---|
| Unadjusted, descriptive only | 0.8693 | 0.8014–0.9429 | 0.00073 | Independence |
| Adjusted for total symptom count, age and sex (pre-specified) | 0.9296 | 0.8563–1.0092 | 0.0816 | Independence |
Second, we have to be transparent about a change we made to the statistical model itself, after seeing a result. The plan we committed in advance specified a particular statistical structure (an “exchangeable” working correlation, in the technical language of the method) for this comparison, mirrored from our primary model. That structure simply would not fit the data. The model failed to converge. The reason turned out to be structural: the outcome here is a proportion of a respondent’s own endorsed criteria, so it’s mathematically compositional, and dependence within a person’s own answers runs negative rather than positive, which broke the assumption the original plan had carried over from the primary analysis by analogy.
The fix, switching to a simpler, more conservative statistical structure (“independence,” in the same language, whilst keeping every other part of the model, including the robust standard errors, identical), is standard practice for this kind of failure, and it does not change what the estimate means. But in the interests of full disclosure: the fix was decided after the failed model, and the fitted result of the fix, had already been seen internally, under an explicit quarantine label pending a ruling from the project owner. We are naming that sequence because committing to a plan in advance is only meaningful if departures from it are disclosed exactly as they happened, not smoothed over. Two facts limit the risk this creates: the fix is the standard, most conservative repair for this specific failure mode, dictated by the mathematics rather than chosen to flatter a result, and the fixed model produced a null, which is not the kind of outcome anyone would engineer a deviation to reach.
What else we checked, and didn’t chase
A handful of secondary checks, all pre-specified, came back with results that don’t tidily support or undermine the headline finding, and per our own pre-specified reporting commitment, we’re printing all of them rather than only the ones that flatter the story.
| Check | What came back | Numbers | Status | How we’ve treated it |
|---|---|---|---|---|
| Is BMI’s relationship to these criteria a straight line? | No. All three curvature tests came back significant. | quadratic χ² = 8.00, p = 0.0047 set-specific p = 0.019 4-knot spline p = 0.0079 | Reported, not promoted | The primary model stays linear because that specification was locked before any of this was tested. Both halves belong in the same sentence. |
| Does a different statistical method agree? | Only partly. An item-response-theory check agreed on 6 of the 11 criteria. | 6/11 agreement 2PL, Swaminathan–Rogers DIF | Reported, not promoted | The two methods ask overlapping but distinct questions. Where they disagree, the disagreement is the finding; we have not adopted whichever told the tidier story. |
| Does the prior criterion-9 sex difference replicate? | No. The specific result reported by Saffari and colleagues (2022) did not reproduce here. | criterion 9: uniform p = 0.242 non-uniform p = 0.909 flagged instead: 2, 3, 5, 8, 11 (BH-corrected: 3, 5, 8 survive) | Reported, not promoted | Recorded as a named replication failure rather than quietly substituting our own criteria for the one prior work flagged. The plan specified uncorrected p-values here, so all five flagged criteria are reported, with the BH split shown. |
| Does criterion endorsement vary by age? | Yes, strongly — but with no direction pre-specified, because no prior literature gave us one to test. | χ² = 149.29, df = 60 p = 1.4 × 10⁻⁹ | Exploratory | Descriptive rather than confirmatory. A genuine pattern worth a dedicated study with its own plan fixed in advance, not a claim made here. |
BMI’s relationship to criterion endorsement isn’t perfectly linear. A quadratic term added to the model was significant (p = 0.0047), as was a version allowing the curve to differ by criterion set (p = 0.019) and a more flexible spline-based check (p = 0.0079). We didn’t switch the primary model to account for this, because the simpler, linear specification was locked in before any of this was tested. But both facts belong in the same sentence: all three checks found evidence that a straight line is an incomplete description of BMI’s relationship to these criteria in this sample, and we deliberately didn’t chase that with the primary result. Note what those tests do and don’t establish: they say the linear specification is incomplete here, not what the true shape is.
A separate statistical approach agreed with our criterion-level results on only 6 of the 11 criteria. That approach is a differential-item-functioning analysis built on an item-response-theory model: it estimates each respondent’s underlying trait level, then tests whether a criterion behaves differently for people at the same trait level but different BMI. It is a related but distinct question from the direct regression contrast our primary model uses, and the comparison here is against the eleven criterion-level secondary results rather than against the primary set-level contrast. When two reasonable methods looking at overlapping questions agree on half the picture and disagree on the rest, the right response is to report the disagreement as a finding in itself, not to quietly prefer whichever method tells the tidier story.
We tried, and failed, to replicate a specific prior finding from the published literature. A 2022 study by Saffari and colleagues, using a Taiwanese university sample, found a gender-related difference specifically on criterion 9 (failure to fulfil role obligations). [2] In our sample, that same test came back null (uniform p = 0.242, non-uniform p = 0.909). Interestingly, sex-related differences did show up, just on different criteria than the one prior work had flagged. The plan specified uncorrected p-values for this arm, and on that basis five criteria were flagged: 2, 3, 5, 8 and 11. That list thins out if the same multiplicity correction used elsewhere in the study is applied to it. Criteria 3, 5 and 8 stay comfortably below q = 0.05; criterion 11 lands at q = 0.0503 and criterion 2 at q = 0.0647, both just the wrong side of the line. Reporting all five is what the plan called for, but a reader deserves to see which of them would survive the stricter test and which sit on the boundary. We’re reporting this as a failure to replicate a specific, named prior result, which is a more useful statement than either ignoring the prior study or quietly substituting our own finding for it.
Criterion endorsement also varies meaningfully by age band, tested with no pre-specified direction since no prior literature gave us one to test (joint test across the age-by-criterion interaction: χ² = 149.29, df = 60, p = 1.4 × 10⁻⁹). This is exploratory and descriptive rather than confirmatory, a genuine pattern worth a dedicated future study, not a claim we’re making strongly here.
What this study can, and can’t, tell you
None of the above should be read with more confidence than the design allows, and it’s worth being explicit about the limits rather than leaving them to a small-print section at the very end.
Height and weight were self-reported, not measured by a clinician, which introduces the well-documented tendency for both to be reported with some inaccuracy. [3] The sample is self-selected: people who go looking for an online food addiction quiz are not a random sample of the population, and are likely to differ systematically from people who don’t, in ways that could affect these results in either direction. The data are cross-sectional, collected at a single point in time, so nothing here can establish that one thing causes another, in either direction. And BMI itself is a genuinely crude measure of body composition. It cannot distinguish muscle from fat, doesn’t account for where fat is distributed, and Creative Touch’s own body composition explainer already makes this case in detail. We’re reinforcing that existing position here, not revisiting it, and a study like this one is exactly the kind of place where BMI’s bluntness matters most, because it’s the exposure variable the entire analysis rests on.
Most of the submissions we started with are not in this study, and that deserves saying plainly rather than leaving it to the flow diagram. Of 6,105 frozen submissions, 4,207 (68.9%) were dropped for missing at least one of BMI, age band or sex. This is a complete-case analysis, with no imputation. The reason is mostly structural rather than sinister: the demographics section of the quiz is explicitly optional, sits after the questionnaire itself, and carries a prominent “Skip to Results” button, so a large share of people simply never filled it in. Of the 6,105, 4,373 reached the section at all and 1,898 completed enough of it to be usable, which means the attrition splits roughly into people who skipped it outright and people who started it and left something blank. Neither group is a random sample of the whole. We have no way to rule out that people willing to state their height, weight, age and sex differ systematically from those who weren’t, in ways that could bear on exactly the relationships this study is about, and we did not model the missingness. Every number in this article describes the 1,796 who answered, not the 6,105 who took the quiz.
The model itself makes simplifying assumptions we can name but did not test. The primary model allows one shared age effect and one shared sex effect across all the criteria at once, and a single common coefficient for the severity adjustment. Our own secondary results give reason to doubt all three: the age-by-criterion interaction was strongly significant, sex-related differences appeared on several individual criteria, and there is no particular reason a single severity coefficient should fit criteria that differ as much as craving and role failure do. Because age and BMI are themselves related, incomplete adjustment for criterion-specific age effects could in principle leak into the very contrast the study rests on.
We have not run those alternative specifications, and that is a deliberate choice rather than an oversight. The primary model was fixed before any result was seen, and fitting new versions of it now, knowing what the answer looks like, is exactly the freedom that committing to a plan in advance is meant to remove. Naming the assumption is honest; quietly refitting until something fits better would not be. A study designed from the start to test these specifications is the right way to settle it. On the same principle, country was recorded but not adjusted for, because the plan did not specify it; given that family concern, hazardous-use interpretations and willingness to report weight all plausibly vary by culture, that is a real gap and not a trivial one.
Five further limitations are specific to this design, and one is serious enough that we’ve already given it a full section above rather than a footnote here. Criterion 7’s own measurement was compromised for the entire life of the tool that generated this data, contaminating both that criterion’s individual result and, via the severity adjustment every other criterion is conditioned on, the primary model itself, in a way that can’t be corrected retrospectively because the data needed to correct it was never stored. Deduplication isn’t possible: each quiz submission carries a unique code, so we cannot tell a genuine repeat-tester from a first-time respondent, and no attempt was made to guess.
The design has a validity ceiling that conditioning cannot remove. Content confounding, reverse causation, and a form of selection bias called collider bias (where two things that each independently make someone more likely to take the quiz, higher symptom severity and higher BMI, can create an association between them that has nothing to do with either causing the other) all predict exactly the same observable pattern we found. Conditioning on overall severity strengthens the case that any content-specific signal isn’t simply severity in disguise, but it cannot rule out reverse causation or selection bias, and this design tests an association pattern, not a mechanism. That distinction matters and we’re not going to blur it for a tidier conclusion.
Two of the specific criteria in our hypothesised content-confounded set, interpersonal problems (criterion 8) and role failure (criterion 9), were also the two lowest-endorsed, and therefore the two least statistically powered, criteria in the whole study, a limitation of the design that holds regardless of what the results happened to show. And finally, no analysis of the full 35-item questionnaire was possible. Individual item-level answers are only stored in Creative Touch’s database when the criterion they belong to was actually met, which means the missing data pattern is tied directly to the outcome itself. Treating a missing answer as equivalent to “answered zero” would manufacture a false correlation, so we didn’t attempt any analysis at that finer level.
Where this sits in the wider research
Two published studies have already asked versions of this question, and they disagree with each other, which is itself part of the framing here. Chapron and colleagues (2023), working with 508 people already in treatment for obesity or addiction, used item-response theory to test whether BMI changed how these same eleven criteria behaved, and found significant differences, but the published abstract doesn’t say which specific criteria carried that signal. [4] Saffari and colleagues (2022), working with 974 Taiwanese university students, ran a similar test and found none by weight status at all, only a single gender-related difference on criterion 9. [2] Two well-conducted studies, in different populations, reaching opposite conclusions.
| Study | Sample | Method | What they found | Population |
|---|---|---|---|---|
| Saffari and colleagues, 2022 | 974 Taiwanese university students | Item-response theory (DIF) | No differences by weight status at all. One sex-related difference, on criterion 9. | A general student population, not help-seeking. |
| Chapron and colleagues, 2023 | 508 people already in treatment for obesity or addiction | Item-response theory (DIF) | BMI-related differences found — but the published abstract does not say which criteria carried the signal. | A clinical population at the severe end. |
| This study, 2026 | 1,796 self-selected online quiz respondents | Severity-adjusted logistic GEE, hypothesis fixed in advance | Named the specific criteria and tested a stated mechanism. Partly supported; criterion 4 ran counter to its own set. | Self-selected and help-seeking, unlike either of the above. |
Our contribution sits in the gap between them: naming which specific criteria carry a BMI signal, testing a stated content-confounding hypothesis decided in advance rather than scanning the data for whatever turns up, and doing so in a large, self-selected, help-seeking sample unlike either prior study’s population. We are not claiming to be first to notice that BMI and this questionnaire interact. That question has already been asked twice, with conflicting answers. What hasn’t previously been done, as far as we could establish, is naming the specific criteria and testing a specific mechanism against them directly.
It’s also worth being clear about a gap in the wider literature: we did not identify a citable, pooled correlation figure for continuous food-addiction score against continuous BMI. The closest comparable published figures concern how many people meet the questionnaire’s own classification threshold (around 20%, 95% CI 18–21%, across a large pooled review) rather than the strength of the underlying dose-response relationship. [5] We’re stating that gap plainly rather than inventing a benchmark number to compare ourselves against. Separately, three independent validation studies in different populations have supported a single-factor structure for this questionnaire rather than several sub-dimensions. [6][7][8] Our finding doesn’t challenge that. It’s a finding about differential validity against an external measure (body weight), not a claim that the test itself needs restructuring.
What this means if you’ve taken this test
If you’ve taken this questionnaire and scored highly on some of these specific criteria, this research has something to say to you directly, and we want to say it carefully. Read plainly, part of what we found is that, at an equal level of overall symptom severity, being in a larger body predicted a slightly lower chance of endorsing the criterion built around stopping other important things, like work or time with family and friends, because of how much or how often you were eating certain foods, and a somewhat higher chance of endorsing things like your family or friends being worried about how much you overate, or continuing to eat foods you knew were physically dangerous given a health condition you already had. Read plainly, some of that second group of findings may be less about your own relationship with food than about how other people respond to your body.
We have to be honest about that word “may”. Our data cannot separate that reading from at least two others that predict exactly the same pattern, one of which is simply that people who already felt judged about their weight were more likely to go looking for a food addiction quiz in the first place. We’re not saying that to moralise, and we’re not saying it to undermine anyone’s own sense of whether food feels like a problem for them. We’re saying it because a test that mixes “how your body responds to food” with “how the people around you respond to your body” is measuring more than one thing, and knowing that can change how you read your own score.
This does not mean the questionnaire is broken, and it doesn’t mean the concept of food addiction is simply social stigma wearing a clinical label. Three separate validation studies, in different populations, have supported a single coherent underlying construct for this scale, [6][7][8] and our own headline test, that BMI predicts the content-adjacent criteria more than the pharmacological ones even after accounting for overall severity, passed. What we’d encourage, rather than discarding the score, is treating a high total less as a single verdict and more as an invitation to look at which specific things you endorsed, and asking honestly which of those feel like they’re about your relationship with food itself and which feel more like they’re about how your life has been shaped by other people’s reactions to your body. Those are different things to work on, and they call for different kinds of support.
Where Creative Touch fits
We built the free YFAS 2.0 quiz that generated this dataset as an educational tool, not a diagnostic one, and this study doesn’t change that. If your own results have left you wanting to understand what the questionnaire is actually measuring before you interpret your score, our explainer on the Yale Food Addiction Scale covers what each part of it is designed to capture. If what you’re sitting with feels less like addiction and more like a preoccupation with food that’s followed a period of restriction or dieting, our piece on food restriction versus food addiction may be the more useful next read. And if this article has left you wondering how much weight BMI itself should carry in how you think about your body, our body composition guide walks through what BMI does and doesn’t capture, alongside our free body composition calculator. None of this replaces a conversation with a GP or a mental health professional if food, weight or eating patterns are causing you distress. These tools exist to help you understand your own patterns more clearly, not to stand in for that conversation.
Frequently asked questions
Not unfair, but not uniform either. Our results suggest that at an equal level of overall symptom severity, the five criteria we grouped in advance as content-confounded showed a stronger average link to BMI than the three pharmacological-core criteria. That is a statement about the two group averages, not about each criterion individually: only three of the five sat above the no-association line, and one of them, activities given up, ran significantly the other way. It means your total score may partly reflect factors connected to body size alongside factors connected to eating behaviour itself, which is worth knowing when you interpret your own result, but doesn’t mean the tool is measuring something false.
No. Three independent validation studies, in different populations, support a single coherent underlying construct for this questionnaire, [6][7][8] and nothing in our findings challenges that. What we’d suggest instead is looking at which specific criteria you endorsed rather than only the total, since some individual questions carry a demonstrably stronger link to body weight than others.
No, and this is one of the most important limits of the design. This is a cross-sectional study, meaning everything was measured at one point in time, so it cannot establish that anything caused anything else, in either direction. Reverse causation (where the criteria came first and influenced weight over time) and selection effects (where people who are both heavier and more symptomatic were simply more likely to take the quiz in the first place) would produce an identical-looking pattern in this data. We can say there’s a specific, content-linked association pattern; we can’t say why it exists.
Possibly, in one specific way. If you were flagged as endorsing criterion 7 (withdrawal), some or all of that may have come from a question about eating more than planned rather than from anything about withdrawal itself. It’s also possible you experienced genuine withdrawal symptoms that weren’t credited towards that criterion at all, because the correct question was never wired into the scoring. The tool has now been fixed, so anyone taking it from here has their withdrawal criterion scored on the right questions. This affects one criterion out of eleven, not your whole result, and it was never the only route to a high total score. If it matters to you, retaking the corrected quiz will give you a more accurate read on withdrawal specifically.
The analysis plan and all three scripts are published in full. The statistical analysis plan sets out the hypotheses, the models and the decision rules as they were committed before any result was seen, and carries its own log of the two departures from it. extract.py pulls the responses and applies every exclusion, analyse.py fits every model, and make_figures.py draws every chart. Between them they contain the frozen date range, each exclusion in the order it was applied, every model specification and every plotted coordinate, so the analysis can be read line by line rather than taken on trust. The individual responses themselves are not published, and will not be. See the data and methods note below for what that means in practice.
Data and methods availability
The pre-specified statistical analysis plan (SAP v1.0) was committed to our git history before any inferential analysis was run, and the analysis script was committed separately afterwards, 88 minutes later. Both are timestamped, and both are now published. The plan appears exactly as it was committed, future tense and all, including the places where its own planning numbers were later superseded and the deviations log that supersedes them; a pre-registration rewritten after the results are known is not one. Alongside it are the three scripts as they ran: extract.py (the data pull, the 25 July 2026 freeze written as a literal in the query, and every exclusion), analyse.py (every model, every pre-specified decision rule, both logged deviations) and make_figures.py (every figure). One redaction has been made and it is marked in the file: the database credentials in extract.py now read from environment variables. Nothing else differs. The ordering of those commits is still something we attest to rather than something a registry attests to, for the reasons given above, but the plan and the code are no longer in that category: anyone can read what was decided and what was run.
We publish aggregated findings, like the ones in this article, not individual responses. That’s a commitment in our privacy policy, and it’s one this article keeps: nobody gets access to identified, individual-level answers, on request or otherwise.
Two logged, dated deviations from the plan exist. One is the statistical model change for our second research question, described above in the discordant-phenotypes section. The other is the criterion 7 measurement defect and its sensitivity analysis, described in full in its own section above. Both are recorded in the SAP’s deviations log. One figure in this article, the proportion of criterion 7 endorsements arising solely from the misplaced item, sits outside the analysis script by necessity, since make_figures.py deliberately never touches the live database; it’s stated independently in two separate records, one of them the published plan’s own deviations log, and they agree.
Consent, and what respondents were told. Nobody could start the questionnaire without passing a consent step first. It required three separate confirmations: that the respondent consented to their anonymous responses and location data being collected and processed as described, that they had read the privacy policy, and that they were 18 or over. The same screen set out what is collected (questionnaire responses, approximate location derived from IP address at city, region and country level, and optional demographics), what it is used for, and what rights respondents have. Research use was stated up front rather than assumed after the fact: one of the three declared purposes was, in the quiz’s own words, to “build aggregate statistics to advance food addiction research”. This analysis is that purpose being carried out. Responses are anonymous by design: no full IP address and no directly identifying information is stored, and no account or email is required to take the quiz. The demographic questions this study depends on are labelled optional, sit after the questionnaire itself and can be skipped with a single button, which is why so many submissions lack them, and respondents can ask to see, correct or delete their data, or withdraw consent, at any time.
Competing interests. This is not independent research and we are not going to present it as such. Creative Touch built and operates the quiz that produced this dataset, discovered and fixed the scoring defect described above in its own code, designed the analysis, ran it, and is publishing the result on its own commercial website, which also links to related Creative Touch tools and content. That combination is worth stating plainly because it is exactly the arrangement a sceptical reader should want disclosed. It does not make the numbers wrong, and the pre-committed plan, the published scripts and the counter-findings reported above are all there so the work can be checked rather than trusted. Funding: none external; the study was carried out in-house at Creative Touch’s own cost. External involvement: none. The analysis has not been peer reviewed, and no independent statistician or clinician has reviewed it on our behalf.
References
Gearhardt, A., Corbin, W., Brownell, K. (2016). Development of the Yale Food Addiction Scale Version 2.0. Psychology of Addictive Behaviors, 30(1), 113-121. doi.org/10.1037/adb0000136
doi: 10.1037/adb0000136Saffari, M., Fan, C.W., Chang, Y.L., Huang, P.C., Tung, S.E.H., Poon, W.C., Lin, C.C., Yang, W.C., Lin, C.Y., Potenza, M.N. (2022). Yale Food Addiction Scale 2.0 (YFAS 2.0) and modified YFAS 2.0 (mYFAS 2.0): Rasch analysis and differential item functioning. Journal of eating disorders, 10(1), 185. doi.org/10.1186/s40337-022-00708-5
doi: 10.1186/s40337-022-00708-5Connor Gorber, S., Tremblay, M., Moher, D., Gorber, B. (2007). A comparison of direct vs. self-report measures for assessing height, weight and body mass index: a systematic review. Obesity reviews : an official journal of the International Association for the Study of Obesity, 8(4), 307-26. doi.org/10.1111/j.1467-789X.2007.00347.x
doi: 10.1111/j.1467-789X.2007.00347.xChapron, S.A., Kervran, C., Da Rosa, M., Fournet, L., Shmulewitz, D., Hasin, D., Denis, C., Collombat, J., Monsaingeon, M., Fatseas, M., Gatta-Cherifi, B., Serre, F., Auriacombe, M. (2023). Does food use disorder exist? Item response theory analyses of a food use disorder adapted from the DSM-5 substance use disorder criteria in a treatment seeking clinical sample. Drug and alcohol dependence, 251, 110937. doi.org/10.1016/j.drugalcdep.2023.110937
doi: 10.1016/j.drugalcdep.2023.110937Praxedes, D.R.S., Silva-Júnior, A.E., Macena, M.L., Oliveira, A.D., Cardoso, K.S., Nunes, L.O., Monteiro, M.B., Melo, I.S.V., Gearhardt, A.N., Bueno, N.B. (2022). Prevalence of food addiction determined by the Yale Food Addiction Scale and associated factors: A systematic review with meta-analysis. European eating disorders review : the journal of the Eating Disorders Association, 30(2), 85-95. doi.org/10.1002/erv.2878
doi: 10.1002/erv.2878Brunault, P., Berthoz, S., Gearhardt, A.N., Gierski, F., Kaladjian, A., Bertin, E., Tchernof, A., Biertho, L., de Luca, A., Hankard, R., Courtois, R., Ballon, N., Benzerouk, F., Bégin, C. (2020). The Modified Yale Food Addiction Scale 2.0: Validation Among Non-Clinical and Clinical French-Speaking Samples and Comparison With the Full Yale Food Addiction Scale 2.0. Frontiers in psychiatry, 11, 480671. doi.org/10.3389/fpsyt.2020.480671
doi: 10.3389/fpsyt.2020.480671Martini-Blanquel, H.A., Mendiola-Pastrana, I.R., Hernández-López, R.G., Guzmán-Covarrubias, D., Romero-Henríquez, L.F., Rivero-López, C.A., López-Ortiz, G. (2025). Cross-Cultural Adaptation and Psychometric Validation of the YFAS 2.0 for Assessing Food Addiction in the Mexican Adult Population. Behavioral sciences, 15(8), 1023. doi.org/10.3390/bs15081023
doi: 10.3390/bs15081023Linardon, J., Messer, M. (2019). Assessment of food addiction using the Yale Food Addiction Scale 2.0 in individuals with binge-eating disorder symptomatology: Factor structure, psychometric properties, and clinical significance. Psychiatry research, 279, 216-221. doi.org/10.1016/j.psychres.2019.03.003
doi: 10.1016/j.psychres.2019.03.003