
Ferritin
Ferritin is the body’s primary iron storage protein and the most informative single blood test for iron status. Standard UK laboratory reference ranges, however, are calibrated to diagnose clinical anaemia rather than to identify the functional threshold below which fatigue, brain fog, and reduced exercise tolerance consistently appear. Multiple converging lines of evidence place this physiologic threshold at 50 µg/L; the lower limit of normal in most UK labs sits between 10 and 20 µg/L. For people using tirzepatide, the risk of depleted iron is compounded from three directions simultaneously: reduced dietary intake, gastrointestinal losses, and obesity-related inflammatory iron sequestration. Persistent tiredness after the adjustment period warrants full iron studies – not just a full blood count.
Ferritin is the protein the body uses to store iron safely within cells. A small fraction leaks into the bloodstream during synthesis, making serum ferritin the most accurate non-invasive proxy for total body iron stores available in routine clinical practice – each 1 µg/L of serum ferritin corresponds to roughly 8–10 mg of stored iron. Its central role in iron status assessment makes it one of the most commonly ordered blood tests in UK primary care, yet the reference ranges used to interpret it are poorly calibrated for detecting the functional iron deficit that causes fatigue long before haemoglobin falls. [5]
What Ferritin Actually Measures
Ferritin consists of 24 subunits arranged in a hollow sphere capable of storing up to 5,000 iron atoms per molecule. Its production is tightly regulated by intracellular iron: when iron is abundant, ferritin mRNA is translated freely to package the surplus safely; when iron is scarce, translation is suppressed, keeping iron available for functional use rather than storage. [5]
This regulatory mechanism has a diagnostically important consequence. Ferritin is an acute-phase reactant – it rises with inflammation. But this rise only occurs when iron is genuinely present, because protein synthesis requires it. In states of concurrent iron deficiency and active inflammation – which is precisely the metabolic situation many people are in at the start of Mounjaro treatment – ferritin cannot climb above approximately 100 µg/L regardless of inflammatory activity. A ferritin result that remains low despite clearly elevated CRP is therefore a stronger signal of genuine deficiency, not a weaker one. [5]
The Reference Range Problem
The serum ferritin lower limit of normal in most UK clinical laboratories sits between 10 and 20 µg/L. This figure is derived statistically – the lowest 2.5% of values in a reference population – rather than from any physiologic measure of what constitutes adequate iron. The consequence is systematic underdiagnosis, particularly in women. Studies using bone marrow iron staining in healthy women have found absent marrow iron stores in approximately 30–50% of subjects – which means a population-derived lower limit places the majority of iron-deficient women squarely within the “normal” band. [5]
The threshold the evidence consistently identifies as physiologically meaningful is 50 µg/L. At this level, multiple convergent findings align: intestinal iron absorption – which compensatorily increases during deficiency – returns to baseline; sensitive markers of iron depletion including soluble transferrin receptor and hepcidin normalise; and, most directly, three randomised controlled trials have demonstrated that iron supplementation in women with normal blood counts but ferritin below 50 µg/L produces significant improvements in fatigue. [5]
Clinical Pearl A client who returns a ferritin of 22 µg/L will typically be told her iron levels are normal. At that level, the clinical trial evidence consistently shows iron-responsive fatigue. The standard normal range is not the fatigue threshold.
For clinical diagnosis, ferritin below 30 µg/L is the most sensitive and specific indicator of iron deficiency in otherwise uncomplicated presentations, and is the threshold used in UK primary care assessment for suspected deficiency. [11] The gap between 30 µg/L (diagnostic threshold) and 50 µg/L (physiologic threshold) is the grey zone where fatigue is common, iron-responsive, and routinely missed.
Iron Deficiency Without Anaemia
Anaemia – a measurable fall in haemoglobin – is a late-stage consequence of progressive iron depletion. The body prioritises erythropoiesis for as long as possible, stripping iron from muscles and other tissue to maintain haemoglobin before allowing it to fall. In one study, measurable muscle iron depletion was documented as ferritin declined from 75 to 36 µg/L – well before any haematological abnormality appeared. [5]
This means clients presenting with fatigue, brain fog, reduced exercise tolerance, difficulty concentrating, headache, or restless legs – but with entirely normal full blood count results – may be in moderate iron deficiency that standard blood tests will miss entirely.
The symptom picture of iron deficiency without anaemia is wider than most expect. Iron-containing enzymes are involved in energy metabolism, neurotransmitter synthesis, thyroid hormone conversion, and mitochondrial function. Their impairment at low iron concentrations is independent of haemoglobin status. The resulting fatigue is cellular and metabolic in character – it persists even at modest exertion and does not resolve with rest – rather than the oxygen-delivery fatigue associated with frank anaemia. Clinicians who have managed iron-deficient patients without anaemia consistently report that symptoms including prolonged fatigue, brain fog, muscle pain, and headache have been variously misattributed to subclinical hypothyroidism, chronic fatigue syndrome, fibromyalgia, and burnout before the ferritin result was correctly interpreted. [11]
Ferritin in Obesity: When the Test Misleads
Obesity and chronic metabolic inflammation add a layer of complexity that is directly relevant to the Mounjaro client at the start of treatment.
Excess adipose tissue drives persistent low-grade inflammation, elevating circulating IL-6, TNF-alpha, and CRP. IL-6 is the primary signal for hepatic hepcidin synthesis, and hepcidin is the master regulator of systemic iron homeostasis: it degrades ferroportin transport proteins on intestinal cells and macrophages, simultaneously blocking dietary iron absorption and preventing release of iron already held in macrophage stores. The result is functional iron restriction – iron is present in the body but locked away, unavailable for haemoglobin synthesis or cellular use. [3]
Because ferritin is an acute-phase reactant that rises with the same inflammatory milieu driving hepcidin, it may read deceptively normal or elevated in clients with genuine iron deficiency. A client arriving at a Mounjaro consultation with a BMI of 38 and elevated CRP can return a ferritin of 60–80 µg/L while being functionally iron-restricted at the cellular level. The elevated reading reflects inflammation, not iron availability. High body mass index has been specifically associated with hyperferritinaemia irrespective of actual iron stores. [1]
In these clients, the appropriate diagnostic framework shifts. Iron deficiency in the context of inflammation should be considered at ferritin below 100 µg/L – or, where ferritin falls between 100 and 299 µg/L, when transferrin saturation (TSAT) is below 20%. This combined criterion was used to define iron deficiency in the FAIR-HF heart failure trials precisely because cardiac inflammation, like metabolic obesity-related inflammation, makes isolated ferritin interpretation unreliable. [11]
GLP-1 Medications and the Iron Question
The most specific quantitative evidence for a GLP-1-ferritin relationship comes from a Danish register-based cohort study (Bain et al., 2023) that analysed 6,529 ferritin measurements in 439 people with hereditary haemochromatosis and type 2 diabetes. GLP-1 receptor agonist use was associated with approximately 30% lower ferritin levels compared with no drug exposure (95% CI 10–40%), a difference that widened to approximately 40% compared with SGLT-2 inhibitor users over four years of follow-up. [1]
Several caveats are important. The study population had hereditary haemochromatosis – pathological iron accumulation – meaning baseline ferritin was dramatically higher than in the general population and the ferritin-lowering effect, in that specific context, was a potential therapeutic benefit rather than a harm. The study was funded by Novo Nordisk and included multiple Novo Nordisk authors; the authors themselves describe the findings as hypothesis-generating and call for confirmation in larger, more diverse populations. The mechanism by which GLP-1 receptor activation might reduce ferritin is not established – proposed hypotheses include anti-inflammatory effects reducing the IL-6-driven hepcidin signal (potentially freeing trapped iron) and delayed gastric emptying altering the duodenal absorption environment, but neither has been confirmed in controlled studies. [1]
What is not hypothesis-generating is the nutritional context. A 2025 observational study of 69 GLP-1 users found that over 60% consumed below estimated requirements for iron, and mean daily protein intake was critically below therapeutic targets across the cohort. [4] A 2025 multi-society advisory published simultaneously across four professional journals (Mozaffarian et al.) lists iron as a specific nutrient requiring attention during GLP-1 therapy. [7]
The broader picture for tirzepatide users is three-front iron pressure: reduced dietary supply from appetite suppression, additional losses through nausea, vomiting, and diarrhoea during the early weeks, and the pre-existing functional iron restriction driven by adipose inflammation that is already in place before the medication starts. The early weeks of treatment are the highest-risk window. The picture is expected to improve as weight falls, inflammation reduces, and hepcidin-driven sequestration eases – the same trajectory described for energy levels in the article. But that improvement is not guaranteed without attention to iron intake and, when indicated, supplementation.
Testing and Treatment Approach
Ferritin alone is insufficient for iron status assessment in Mounjaro users with significant metabolic inflammation, particularly in the early months of treatment. Full iron studies provide the necessary context:
| Test | What it shows | Limitation |
|---|---|---|
| Serum ferritin | Total iron stores | Inflated by inflammation; requires contextual interpretation |
| Serum iron | Circulating iron | Falls in both deficiency and inflammation; limited standalone utility |
| Total iron binding capacity (TIBC) | Binding protein capacity | Elevated in true deficiency; suppressed by inflammation and malnutrition |
| Transferrin saturation (TSAT) | Ratio of serum iron to TIBC | Most reliable functional indicator when ferritin is ambiguous |
| Full blood count | Haemoglobin, MCV | Late marker; necessary context but a normal result does not exclude deficiency |
The interpretation target in non-inflammatory presentations is ferritin above 50 µg/L for symptom resolution; the treatment target is sustained ferritin above 100 µg/L. [11] Where inflammation is present, TSAT above 20% is required alongside ferritin to confirm adequate iron availability. Symptom resolution often lags laboratory improvement; treatment should be continued for six to twelve months rather than discontinued as soon as ferritin rises, with repeat ferritin measurements at regular intervals to confirm levels are stable after treatment is stopped. [11]
Clinical Application
Iron is a required cofactor for two of the most important enzymes in skin biology – prolyl 4-hydroxylase and lysyl hydroxylase – making iron status a direct upstream variable in collagen synthesis. This connection is rarely discussed in aesthetics contexts, and it means that a client whose collagen response is underwhelming may have a nutritional explanation that no professional treatment can compensate for.
Treatment response and under-response
Prolyl 4-hydroxylase requires both iron and vitamin C as cofactors for the hydroxylation of proline residues in procollagen chains. Without adequate hydroxylation, procollagen cannot form a stable triple helix and is degraded intracellularly before contributing to the extracellular matrix. This is the same bottleneck the collagen entity describes in the context of vitamin C depletion – iron depletion creates an identical failure point through an identical enzyme. A client who has been using a well-formulated vitamin C serum consistently, following a collagen-stimulating treatment course, and still not seeing the tissue improvement the treatment predicts may have iron-related prolyl hydroxylase impairment rather than a treatment efficacy problem.
This applies across the full range of collagen-stimulating treatments: microneedling, RF microneedling, iPRF, skin boosters. All of them depend on the downstream maturation pathway converting procollagen to functional collagen – a pathway that requires iron at the hydroxylation step. A treatment course delivered into a state of iron deficiency is working against a biochemical constraint it has no mechanism to address.
Clinical Pearl Iron is a cofactor for prolyl 4-hydroxylase alongside vitamin C. A client who has optimised vitamin C but remains iron-deficient faces the same procollagen maturation bottleneck – and the same disappointing collagen response – through a pathway that topical skincare cannot reach.
The hair loss connection is similarly direct and better evidenced than the general fatigue literature. Rapidly dividing cells – including hair follicle matrix cells, which are among the fastest dividing in the body – require iron for ribonucleotide reductase, the rate-limiting enzyme for DNA synthesis. The ferritin threshold associated with telogen effluvium is generally placed at 70 µg/L in the dermatology and trichology literature: higher than the fatigue threshold (50 µg/L) and substantially higher than the standard lab lower limit of normal. A client presenting for iPRF hair loss treatment with ferritin of 45 µg/L will be told their bloods are fine. Their hair follicles disagree.
For clients attending for iPRF hair restoration specifically, ferritin below 70 µg/L warrants a direct conversation before committing to a treatment course. The treatment stimulates follicle activity through growth factor delivery; if the follicle cells lack the iron required for DNA replication and the keratinocyte proliferation that drives hair shaft formation, the growth factor signal has insufficient substrate to work with.
Client assessment and conversations
The standard GP blood test ordered for fatigue – a full blood count – will not reliably detect the iron deficiency level that impairs collagen synthesis, hair growth, and energy. Haemoglobin can be entirely normal with ferritin at 20 µg/L. Practitioners whose clients are Mounjaro users or who have undergone significant caloric restriction through any route should be comfortable asking: “Have you had your ferritin checked specifically, not just your general blood count?” – and explaining the distinction if needed.
The three presentations most worth flagging in consultation:
- Persistent fatigue beyond week eight of Mounjaro despite managed GI symptoms and adequate protein – ferritin is the first investigation to request alongside B12 and thyroid
- Hair thinning alongside Mounjaro use – the convergent telogen effluvium triggers ( rapid weight loss, caloric restriction, nutritional depletion) and iron deficiency can compound each other; ferritin should be checked before attributing shedding to weight-loss-related stress alone
- Disappointing response to a collagen-stimulating treatment course – where vitamin C status has been addressed and treatment was technically adequate, iron status is worth investigating before concluding the treatment is ineffective
The referral framing that stays within scope: “I’d recommend asking your GP for full iron studies – specifically ferritin, serum iron, and transferrin saturation, not just the routine blood count – before we plan the next stage of treatment.” This positions the practitioner as informed and protective of the client’s outcome without crossing into diagnostic territory.
Homecare and optimisation
Iron supplementation is straightforward to recommend within scope when ferritin testing has confirmed deficiency. Dietary iron is available as haem iron (meat, fish – higher bioavailability, approximately 15–35% absorption) and non-haem iron (plant sources – lower bioavailability, approximately 2–20% absorption, but substantially increased by concurrent vitamin C). Practitioners already recommending vitamin C supplementation for collagen support can note that the same daily vitamin C provides the co-supplementation benefit.
The interaction with the ferritin-as-misleading-marker problem applies here too: inflammatory conditions (ongoing metabolic inflammation in early Mounjaro treatment) require supplementation to continue for longer than the blood test result alone might suggest. Achieving a ferritin of 35 µg/L on retest is not the endpoint; the physiologic treatment target is sustained ferritin above 100 µg/L.
| Food | Realistic UK portion | Total iron | Type | Absorption range | Absorbed iron (base) | Absorbed iron (+vit C) | Key factor |
|---|---|---|---|---|---|---|---|
| Haem iron sources – absorbed through a dedicated intestinal pathway; not significantly enhanced by vitamin C or inhibited by plant compounds | |||||||
| Chicken liver | 150g | 13.5mg | Haem | 15–35% | 2.0–4.7mg | No effect | Highest iron density of common foods. Rich in B vitamins and retinol. Once or twice a week is a meaningful contribution. |
| Beef liver | 150g | 9.8mg | Haem | 15–35% | 1.5–3.4mg | No effect | Exceptionally rich in haem iron. Weekly consumption advised rather than daily due to high retinol content in pregnancy. |
| Mussels (cooked) | 150g | 10.1mg | Haem | 15–35% | 1.5–3.5mg | No effect | Frequently overlooked. One of the best iron sources per portion and competitively priced. Cockles are comparable. |
| Beef sirloin | 200g (typical steak) | 5.8mg | Haem | 15–35% | 0.9–2.0mg | No effect | Meat factor: haem iron in a meal also enhances non-haem absorption from any plant foods eaten alongside by up to 150%.¹ |
| Lamb (cooked) | 200g | 5.4mg | Haem | 15–35% | 0.8–1.9mg | No effect | Red meats generally provide more haem iron than white meats. |
| Sardines (tinned, in brine) | 100g (1 small tin) | 2.9mg | Haem | 15–35% | 0.4–1.0mg | No effect | Practical and inexpensive. Eaten with vitamin C (e.g. tomato) the vit C doesn’t improve haem absorption but supports non-haem iron from other meal components. |
| Turkey, dark meat | 175g | 3.2mg | Haem | 15–35% | 0.5–1.1mg | No effect | Dark thigh/leg meat contains significantly more iron than white breast meat. The portion matters here. |
| Chicken breast | 175g (1 breast) | 1.2mg | Haem | 15–35% | 0.2–0.4mg | No effect | Commonly cited as a good iron source but absorbed contribution is modest. Better valued for protein in this context. |
| Non-haem iron – good practical sources; absorption meaningfully improved by concurrent vitamin C (25–50mg per meal) and by eating alongside any haem iron | |||||||
| Lentils (cooked) | 200g | 6.6mg | Non-haem | 3–15% | 0.3–0.7mg | 0.7–1.7mg (+vit C) | Phytate present but partially degraded during cooking. Combining with tomato, peppers or lemon juice makes a meaningful difference. |
| Tempeh (fermented soy) | 150g | 4.1mg | Non-haem | 5–15% | 0.3–0.6mg | 0.6–1.2mg (+vit C) | Fermentation breaks down phytate, making tempeh meaningfully better absorbed than unfermented soy (tofu). Meaningfully different from tofu despite similar iron content. |
| White / butter beans (cooked) | 150g | 3.9mg | Non-haem | 3–12% | 0.2–0.5mg | 0.5–1.1mg (+vit C) | Lower phytate than red kidney beans; sensible default for plant-based iron with vitamin C pairing. |
| Fortified breakfast cereal | 40g (1 serving) | ~7.0mg | Non-haem | 5–10% | 0.4–0.7mg | 0.7–1.4mg (+vit C) | Note: fortified iron is often ferric (Fe³⁺) which is less soluble than ferrous. Avoid eating with tea or coffee – polyphenols will sharply reduce absorption. Eat with juice rather than tea. |
| Dried apricots | 50g (small handful) | 1.4mg | Non-haem | 5–15% | 0.1–0.2mg | 0.2–0.4mg (+vit C) | Low inhibitor content makes this one of the cleaner non-haem sources per gram. Total iron per portion is modest – supplementary rather than primary contribution. |
| Non-haem iron – high total iron, poor practical absorption; commonly overstated in standard tables | |||||||
| Spinach (boiled) | 180g | 6.5mg | Non-haem | 2–5% | 0.1–0.3mg | 0.2–0.5mg (+vit C) | The common explanation is wrong. A 2008 controlled isotope study found oxalic acid does not significantly inhibit iron absorption in humans.² The primary inhibitors in spinach are polyphenols and calcium – not oxalate. The myth persists regardless. |
| Dark chocolate 70%+ | 30g (3–4 squares) | 3.6mg | Non-haem | 2–5% | 0.1–0.2mg | 0.1–0.3mg (+vit C) | Iron content looks impressive; polyphenol content makes most of it unavailable. Appears in magnesium and iron tables for the wrong reasons. Eat it anyway – just not as an iron strategy. |
| Pumpkin seeds | 30g (2 tbsp) | 2.6mg | Non-haem | 2–6% | 0.1–0.2mg | 0.2–0.4mg (+vit C) | Excellent magnesium source (159mg/30g); poor iron source due to phytate. Don’t recommend them for iron specifically. |
| Kidney beans (cooked) | 150g | 4.4mg | Non-haem | 2–7% | 0.1–0.3mg | 0.3–0.8mg (+vit C) | High phytate content significantly reduces absorption. Soaking and cooking reduces phytate; eating with vitamin C improves outcomes but kidney beans remain a weak iron source versus their headline iron figure. |
| Tofu (firm) | 150g | 8.1mg | Non-haem | 2–5% | 0.2–0.4mg | 0.4–0.9mg (+vit C) | Total iron is high but phytate from soy is substantial. Fermented versions (tempeh, miso) absorb considerably better. A common source of inflated iron estimates in plant-based dietary assessments. |
Sources: USDA National Nutrient Database (iron per 100g values); Monsen (1988) J Am Diet Assoc (haem absorption range); NIH Office of Dietary Supplements, Iron fact sheet (2026); Hallberg & Hulthén (2000) Am J Clin Nutr (dietary iron absorption modelling). 1 The ‘meat factor’: the presence of haem iron in a mixed meal enhances non-haem iron absorption from plant foods eaten in the same meal – a mechanism distinct from vitamin C enhancement and not negated by inhibitors. Quantified at up to 150% increase in non-haem absorption (West & Oates, 2008, World J Gastroenterol). 2 The oxalate–spinach claim: Bonsmann et al. (2008, Eur J Clin Nutr, PMID 17440529) conducted a controlled isotope study adding oxalic acid to kale meals and found no significant inhibition of non-haem iron absorption in humans. The primary inhibitors in spinach are polyphenols and calcium. The ‘oxalate locks the iron’ explanation, repeated in most content, is not well supported by human data. Absorbed iron ranges are calculated from the confirmed absorption range (e.g., 15–35% for haem iron) applied to total iron per realistic UK portion. Individual absorption varies with iron status – absorption increases significantly when ferritin is low. | |||||||
Methodology
Iron-per-portion values were derived from national food composition tables (USDA FoodData Central [12] and the UK McCance & Widdowson dataset [9] [10] ), using cooked weights that reflect realistic UK serving sizes. For each food, total iron per portion was converted into an estimated absorbed-iron range by applying published absorption coefficients (principally Monsen et al., 1978; [6] Hallberg & Hulthén, 2000; [2] and the NIH Office of Dietary Supplements iron fact sheet, [8] reviewed April 2026). Haem iron from animal sources was modelled at 15–35% absorption, reflecting its dedicated intestinal transport pathway and relative independence from most dietary inhibitors.
Non-haem iron from plant and fortified foods was modelled across lower, context-dependent ranges (typically 2–20%), with adjustments for phytate, polyphenols, and calcium where these are present in meaningful amounts. Vitamin C co-consumption was assumed to enhance non-haem iron absorption by approximately 2–7-fold, while the presence of haem iron in mixed meals was assumed to increase non-haem absorption by up to 150% (West & Oates, 2008, World J Gastroenterol). [13] All values are presented as plausible ranges rather than fixed predictions, acknowledging that individual iron status – for example, low ferritin – can substantially increase absorption efficiency.
Absorption enhancers and inhibitors
| Factor | Effect | Non-haem iron | Haem iron | Practical note |
|---|---|---|---|---|
| Vitamin C (ascorbic acid) | ↑ Enhances | 2–7× increase; reduces Fe³⁺ to absorbable Fe²⁺; prevents phytate binding | Not significantly affected | 25–50mg per meal is sufficient. A small glass of orange juice, half a pepper, or a handful of cherry tomatoes. Timing matters – must be eaten in the same meal, not at a separate time. |
| Haem iron (meat factor) | ↑ Enhances | Up to 150% increase in non-haem absorption from same meal | n/a | A small amount of meat alongside a plant-iron-rich meal (e.g. lentil soup with a small amount of beef, or mussels with bread) substantially improves total iron yield from the meal. |
| Phytates | ↓ Inhibits | Significant – can reduce absorption by 50–90% at high doses | Not affected | Present in wholegrains, legumes, seeds, nuts. Soaking, sprouting, and fermentation reduce phytate content. Vitamin C partially overcomes phytate inhibition. |
| Polyphenols (tea, coffee, red wine, some vegetables) | ↓ Inhibits | Significant – tea at a meal can reduce absorption by 60–70% | Minimal effect | Tea or coffee within one hour of an iron-rich meal is one of the most common and correctable causes of poor iron absorption. Switch to water or juice during meals when iron status is a concern. |
| Calcium (dairy, supplements) | ↓ Inhibits | Moderate inhibition at high doses (>300mg) | Small effect at high doses | Large amounts of dairy in a meal reduce iron absorption. Iron supplements should be taken away from calcium supplements. Modest dairy portions are unlikely to be clinically significant in practice. |
References
Bain SC, Carstensen B, Hyveled L, et al. (2023). Glucagon-like peptide-1 receptor agonist use is associated with lower blood ferritin levels in people with type 2 diabetes and hemochromatosis: a nationwide register-based study. BMJ Open Diabetes Res Care, 11(3) . doi.org/10.1136/bmjdrc-2022-003300
Hallberg L, Hulthén L (2000). Prediction of dietary iron absorption: an algorithm for calculating absorption and bioavailability of dietary iron. Am J Clin Nutr, 71(5), 1147-60 . doi.org/10.1093/ajcn/71.5.1147
Hilton C, Sabaratnam R, Drakesmith H, et al. (2023). Iron, glucose and fat metabolism and obesity: an intertwined relationship. Int J Obes (Lond), 47(7), 554-563 . doi.org/10.1038/s41366-023-01299-0
Johnson B, Milstead M, Thomas O, et al. (2025). Investigating nutrient intake during use of glucagon-like peptide-1 receptor agonist: a cross-sectional study. Front Nutr, 12, 1566498 . doi.org/10.3389/fnut.2025.1566498
Martens K, DeLoughery TG (2023). Sex, lies, and iron deficiency: a call to change ferritin reference ranges. Hematology Am Soc Hematol Educ Program, 2023(1), 617-621 . doi.org/10.1182/hematology.2023000494
Monsen ER, Hallberg L, Layrisse M, et al. (1978). Estimation of available dietary iron. Am J Clin Nutr, 31(1), 134-41 . doi.org/10.1093/ajcn/31.1.134
Mozaffarian D, Agarwal M, Aggarwal M, et al. (2025). Nutritional priorities to support GLP-1 therapy for obesity: A joint Advisory from the American College of Lifestyle Medicine, the American Society for Nutrition, the Obesity Medicine Association, and The Obesity Society. Obesity (Silver Spring), 33(8), 1475-1503 . doi.org/10.1002/oby.24336
National Institutes of Health – Office of Dietary Supplements (2026). Office of Dietary Supplements – Iron. ods.od.nih.gov/factsheets/Iron-HealthProfessional
Public Health England (2015). Composition of foods integrated dataset (CoFID). GOV.UK. gov.uk/…/composition-of-foods-integrated-dataset-cofid (Accessed: 2026-04-28)
Roe M., Pinchen H., Church S., et al. (2015). McCance and Widdowson’s The Composition of Foods Seventh Summary Edition and updated Composition of Foods Integrated Dataset. Nutrition Bulletin, 40(1), 36-39 . doi.org/10.1111/nbu.12124
Soppi ET (2018). Iron deficiency without anemia – a clinical challenge. Clin Case Rep, 6(6), 1082-1086 . doi.org/10.1002/ccr3.1529
U.S. Department of Agriculture (2026). USDA FoodData Central. U.S. Department of Agriculture. fdc.nal.usda.gov (Accessed: 2026-04-28)
West AR, Oates PS (2008). Mechanisms of heme iron absorption: current questions and controversies. World J Gastroenterol, 14(26), 4101-10 . doi.org/10.3748/wjg.14.4101
Also Known As
- ferritin complex
- serum ferritin
Learn More
This topic is discussed in 2 articles:
-
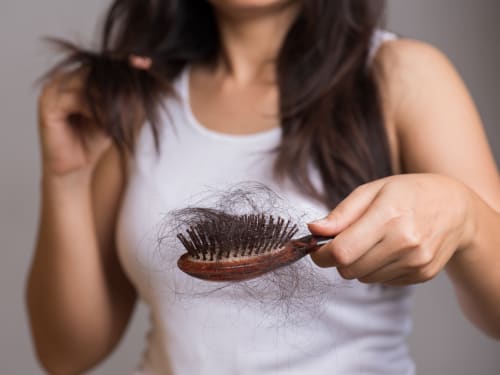
Experiencing hair loss on Mounjaro? Discover why it happens, plus evidence-based prevention strategies, and treatment options. Most cases are temporary and reversible.
-

While many patients experience positive weight loss results from Mounjaro injections, here’s what you should know about tiredness as a potential side effect of Mounjaro.