
Insulin resistance
Insulin resistance is the acquired physiological state in which skeletal muscle, liver, and adipose tissue respond inadequately to normal circulating insulin concentrations, requiring progressively greater insulin secretion from pancreatic β-cells to maintain glucose homeostasis. At the subcellular level the impairment is precisely mapped: plasma-membrane sn- 1,2-diacylglycerol activates PKCε in hepatocytes (impairing insulin receptor kinase activity at Thr1160) and PKCθ in skeletal muscle (phosphorylating IRS-1 at Ser1101), while ceramides activate PP2A to dephosphorylate AKT distal to the receptor. The compensatory hyperinsulinaemia that initially preserves normoglycaemia is self-defeating: elevated insulin upregulates ACC, raises malonyl-CoA, inhibits CPT-1, and drives further esterification overflow and DAG accumulation. In the aesthetic context this produces clinically observable skin signs (acanthosis nigricans, skin tags, PCOS-related features) as well as subtler epidermal consequences: shortened barrier ceramides via ELOVL3/6 suppression, collagen glycation through AGE formation, and cutaneous microbiome dysbiosis. These cutaneous manifestations arise directly from hyperinsulinaemia, IGF-1R cross-activation, and systemic inflammation but do not constitute the primary clinical problem. Insulin resistance is a medical condition requiring formal assessment and management; its detailed inclusion here is mechanistic and educational, enabling aesthetic practitioners to recognise skin signs, frame appropriate referrals, and understand how metabolic health modulates treatment outcomes.
Insulin resistance is not a single molecular defect but an acquired physiological state with multiple parallel contributing mechanisms operating across tissues, accumulating over years, and producing a clinical phenotype that ranges from subclinical metabolic dysfunction to overt type 2 diabetes. Understanding it requires holding three things simultaneously: the normal insulin signalling pathway that defines what resistance means; the molecular mechanisms by which that signalling is impaired; and the tissue-specific consequences of those impairments in liver, muscle, and skin.
Definition and the Resistance Spectrum
Insulin resistance is most precisely defined as a rightward shift in the dose-response relationship between insulin concentration and biological effect. A normal cell achieves its maximal metabolic response – glucose uptake, glycogen synthesis, suppression of hepatic glucose production – at a given insulin concentration. An insulin-resistant cell requires two, three, or five times that concentration to achieve the same effect. The response is blunted, not absent.
This is a continuous spectrum, not a binary state. At the subclinical end it is detectable only by hyperinsulinaemic-euglycaemic clamp (the gold-standard measurement of insulin-stimulated glucose disposal) or by elevated fasting insulin with normal glucose. In the middle it manifests as metabolic syndrome – abdominal obesity, dyslipidaemia (elevated triglycerides, low HDL), elevated blood pressure, and impaired fasting glucose – in which insulin resistance is the unifying underlying mechanism. At the clinical end it becomes type 2 diabetes mellitus, in which β-cell insulin secretory capacity has fallen sufficiently that compensatory hyperinsulinaemia can no longer maintain fasting normoglycaemia.
An important phenotypic clarification: obesity is a strong risk factor for insulin resistance but is neither necessary nor sufficient. The “metabolically obese normal weight” (MONW) phenotype – “skinny fat” – describes individuals with healthy BMI but elevated visceral adiposity, elevated intrahepatic lipid, and measurable insulin resistance – establishing that ectopic fat distribution, not total body mass, is the primary adiposity driver of metabolic dysfunction. Conversely, approximately 25–30 % of individuals with obesity remain metabolically healthy, with preserved insulin sensitivity – consistent with the DAG localisation and β-oxidation capacity data discussed below.
The Insulin Signalling Cascade: What Resistance Disrupts
At the plasma membrane insulin binds to the α-subunit of the insulin receptor, a heterotetrameric receptor tyrosine kinase. Binding triggers trans-autophosphorylation of the β-subunit kinase domain at three tyrosine residues (Y1158, Y1162, Y1163) in the activation loop, fully activating the kinase. The activated receptor kinase phosphorylates IRS-1 and IRS-2 at multiple tyrosine residues → tyrosine-phosphorylated IRS-1/2 recruit the p85 regulatory subunit of PI3K → PI3K generates PIP3 at the inner leaflet → PIP3 recruits PDK1 and mTORC2 → PDK1 phosphorylates AKT2 at Thr308 and mTORC2 phosphorylates AKT2 at Ser473 for full activation. Active AKT2 then drives three principal metabolic outcomes:
- Skeletal muscle: Phosphorylation of TBC1D4 (AS160) and TBC1D1 inactivates Rab-GAPs, maintaining Rab10/Rab8a/Rab14-GTP states → GLUT4 storage vesicles translocate to the plasma membrane → glucose uptake.
- Liver: Phosphorylation of FOXO1 leads to nuclear exclusion, suppressing gluconeogenic genes (PEPCK, G6Pase) and endogenous glucose production; GSK3β is inactivated, de-repressing glycogen synthase → hepatic glycogen synthesis.
- Adipose: Anti-lipolytic effect via AKT → PDE3B activation → cAMP reduction → HSL and ATGL activity reduced → free fatty acid release suppressed.
Insulin resistance impairs this cascade at three distinct levels – proximal (DAG/PKC), distal (ceramide/PP2A), and inflammatory (IKKβ) – which operate simultaneously in most clinical presentations.
| Mechanism | Site of impairment | Molecular target | Primary tissue |
|---|---|---|---|
| DAG/PKCε | Proximal – insulin receptor | IRK-Thr1160 phosphorylation | Liver |
| DAG/PKCθ | Post-receptor – IRS-1 | IRS-1-Ser1101 phosphorylation | Skeletal muscle |
| Ceramide/PP2A | Distal – AKT | AKT dephosphorylation; PKCζ inhibition | Liver and muscle |
| Inflammation/IKKβ | Post-receptor – IRS-1 | IRS-1-Ser307 phosphorylation | Liver and muscle |
Tissue-Specific Consequences
Hepatic insulin resistance primarily manifests as failure to suppress endogenous glucose production. In the normal fed state rising insulin suppresses gluconeogenesis and glycogenolysis within 30–60 minutes via FOXO1 nuclear exclusion. When DAG/PKCε impairs IRK activation at Thr1160, the downstream AKT2 → FOXO1 chain is weakened and hepatic glucose production continues despite elevated postprandial insulin – contributing to fasting hyperglycaemia. Paradoxically, hepatic insulin resistance is selective: the AKT → FOXO1 (anti-gluconeogenic) arm is impaired, while the AKT → SREBP-1c (lipogenic) arm often remains partially intact. This produces the lipogenic paradox of concurrent hyperglycaemia and hypertriglyceridaemia characteristic of metabolic syndrome.
Skeletal muscle insulin resistance primarily manifests as impaired postprandial glucose disposal. Skeletal muscle accounts for ~80 % of insulin-stimulated glucose uptake; when GLUT4 translocation is impaired by DAG/PKCθ-mediated IRS-1-Ser1101 phosphorylation, dietary glucose cannot be efficiently cleared, producing postprandial hyperglycaemia that precedes fasting hyperglycaemia by years in the typical progression toward type 2 diabetes.
The athlete’s paradox – and what it reveals about DAG localisation
Endurance-trained athletes accumulate high intramyocellular lipid (IMCL) – comparable to or exceeding levels seen in insulin-resistant individuals – yet remain highly insulin-sensitive. The resolution lies not in total DAG quantity but in subcellular localisation. In insulin-resistant individuals sn-1,2-DAG accumulates in the subsarcolemmal compartment adjacent to plasma-membrane PKCθ. In trained athletes it accumulates instead in the mitochondrial/ER compartment, where it does not access PKCθ. This mitochondrial/ER sn-1,2-DAG pool correlates positively with insulin sensitivity. Training-driven mitochondrial biogenesis and increased CPT-1 capacity oxidise fatty acids efficiently rather than allowing esterification overflow into the resistance-driving subsarcolemmal pool. [2] [4]
Compensatory Hyperinsulinaemia: The Self-Defeating Adaptation
The pancreatic β-cell response to insulin resistance is to secrete more insulin. This adaptation initially maintains normoglycaemia – sometimes for years or decades – but creates a self-reinforcing cycle that progressively worsens the underlying metabolic dysfunction. Elevated insulin increases SREBP-1c-driven ACC1 and ACC2 expression → both cytosolic and mitochondrial malonyl-CoA rise → CPT-1 is more substantially inhibited → β-oxidation falls → esterification overflow increases → more plasma-membrane sn-1,2-DAG accumulates → deeper PKCε/PKCθ activation → further receptor and IRS-1 impairment → yet higher insulin is required. The compensatory signal directly deepens the mechanistic impairment it was intended to overcome.
β-cell progression follows a recognisable sequence: sustained hypersecretory demand induces ER stress through the unfolded protein response; mitochondrial dysfunction reduces ATP production, impairing the ATP-sensitive K⁺ channel mechanism that triggers insulin secretion; over years progressive β-cell mass is lost. When insulin secretory capacity can no longer compensate – typically when β-cell function has fallen to approximately 50 % of normal – fasting hyperglycaemia emerges and the threshold for type 2 diabetes is crossed. The insulin resistance was present years or decades before the diagnosis; the diagnosis marks the failure of β-cell compensation.
The Inflammatory Amplification Loop
Adipose tissue expansion in visceral obesity activates a parallel inflammatory mechanism that amplifies insulin resistance independently of the DAG/PKC pathway. Expanded adipocytes release elevated free fatty acids (via uninhibited lipolysis) and pro-inflammatory cytokines ( TNF-α, IL-6). Circulating FFAs drive de-novo ceramide synthesis in liver and muscle ( serine + palmitoyl- CoA → ceramide via SPT and CERT). Ceramides activate PP2A, dephosphorylating AKT at Thr308. Macrophage infiltration of visceral adipose tissue (crown-like structures) further amplifies TNF-α production, activating IKKβ → IRS-1-Ser307 phosphorylation. Chronic hyperglycaemia adds a fourth arm: AGEs activate RAGE → NF-κB → oxidative stress and further cytokine release, worsening resistance through the IKKβ arm while cross-linking dermal collagen.
Skin Manifestations: Clinically Observable Signs
Acanthosis Nigricans
Acanthosis nigricans is characterised by velvety, hyperpigmented, papillomatous plaques in intertriginous areas (posterior neck, axillae, groin, antecubital fossae). The mechanism is well-established: compensatory hyperinsulinaemia allows insulin to cross-activate the IGF-1 receptor on keratinocytes and dermal fibroblasts (insulin binds IGF-1R with 100- to 1000-fold lower affinity than IGF-1 but at supraphysiological concentrations this becomes physiologically relevant). Hyperinsulinaemia also suppresses hepatic IGFBP-1 synthesis, elevating free IGF-1 and compounding the proliferative signal. Severity correlates positively with fasting insulin concentration. Practitioners observing these features should refer for metabolic assessment. Aesthetic treatment of overlying skin does not address the underlying cause. [7]
Skin Tags (Acrochordons)
Soft fibroepithelial polyps commonly present on the neck, axillae, and groin. They share the same IGF-1R/fibroblast proliferation mechanism as acanthosis nigricans and show a statistically robust, independent association with insulin resistance and metabolic syndrome across multiple populations, even after adjustment for BMI.
Key primary evidence (selected studies):
| Study | Population | Key Finding | Strength of Association |
|---|---|---|---|
| Tripathy et al. 2019 | Eastern India, case-control | Strong link to metabolic syndrome components | p<0.001 |
| Fang et al. 2020 | Irish bariatric cohort (White European) | Higher fasting glucose, HbA1c, trend to higher HOMA-IR | Independent marker of insulin-resistant phenotype [1] |
| Zhao et al. 2024 | Paediatric dermatology cohort | Higher obesity, dyslipidaemia, elevated LFTs, metabolic syndrome prevalence | BMI positively correlated with tag number [3] |
| Sherin et al. 2023 | South India, cross-sectional | 65 % of skin-tag patients met metabolic-syndrome criteria vs 28 % controls | p<0.001 |
The shared mechanism is hyperinsulinaemia-driven IGF-1 receptor activation on dermal fibroblasts, producing a milder proliferative signal than the epidermal hyperplasia of acanthosis nigricans. In aesthetic practice skin tags are frequently observed during neck, axilla, or groin consultations and are a common reason clients request removal. Multiple tags (>5) or pedunculated/sessile morphology correlates with higher metabolic risk. Their presence offers a practical, non-diagnostic opportunity for a factual conversation: “This pattern can sometimes link to metabolic health; your GP can arrange simple screening tests if you wish.” Removal addresses the cosmetic concern while the broader metabolic context is managed medically.
PCOS-Related Skin and Wound Healing
Polycystic ovary syndrome is strongly associated with insulin resistance (present in ~65–70 % of cases regardless of BMI). Hyperinsulinaemia directly upregulates ovarian theca-cell CYP17A1, elevating androgens that drive acne, hirsutism, and androgenetic alopecia. These features warrant medical assessment.
Chronically elevated glucose impairs wound healing via AGE accumulation (impaired keratinocyte migration), ROS generation (disrupted growth-factor signalling), and microvascular changes. For barrier-disrupting aesthetic procedures (fractional laser, RF microneedling, deep resurfacing) pre-treatment metabolic context is a legitimate consideration for discussion with the client’s medical team.
Skin Biology at the Metabolic Level
Barrier ceramide elongation
The inflammatory cytokine milieu of insulin resistance (elevated IL-4, IL-13, TNF-α) suppresses ELOVL3 and ELOVL6 expression in keratinocytes via STAT6 signalling, reducing the capacity to elongate very-long-chain fatty acids essential for competent barrier ceramides. [6] The ceramide profile therefore shifts toward shorter, less effective acyl chain lengths – a direct epidermal consequence of systemic metabolic dysregulation. Adiponectin (typically low in insulin resistance) further impairs the AMPK/CPT-1 axis in dermal mesenchymal stem cells, altering paracrine signalling to keratinocytes.
Collagen glycation and AGEs
Non-enzymatic glycation of dermal collagen by excess glucose produces advanced glycation end-products that cross-link collagen fibres, rendering them resistant to normal metalloproteinase remodelling. This reduces mechanical flexibility, produces the characteristic yellowish skin tone of advanced glycation, and accelerates structural skin ageing.
Cutaneous microbiome dysbiosis
Case-control and 2025 Mendelian randomisation studies support a causal relationship between type 2 diabetes/insulin resistance and altered cutaneous microbiome composition. The mechanism involves shared innate immune pathways and is hypothesised to amplify systemic inflammation while increasing susceptibility to cutaneous infections – a further consideration for procedural recovery. [9]
Assessment: Clinical Measurement Approaches
Insulin resistance is a medical diagnosis. The following approaches are noted for educational completeness only:
- Hyperinsulinaemic-euglycaemic clamp (gold standard, research tool).
- HOMA-IR = (fasting insulin [μIU/mL] × fasting glucose [mmol/L]) / 22.5 (>2.5 suggestive in European populations).
- Fasting insulin alone (often more sensitive early marker; >12–15 μIU/mL prompts investigation).
- TyG index (triglyceride/HDL ratio surrogate).
- Waist circumference (visceral adiposity surrogate).
Diagnosis and management require qualified medical assessment.
Mechanisms of Restored Insulin Sensitivity
Insulin resistance is reversible or significantly improvable in most cases, particularly earlier on the spectrum. The mechanisms map directly to the impairments described.
Sustained aerobic exercise restores sensitivity through three distinct mechanisms operating on different timescales. Acutely: AMPK activation → ACC2 inactivation → malonyl-CoA falls → CPT-1 de-inhibited → β-oxidation proceeds → subsarcolemmal sn-1,2-DAG is cleared. Simultaneously, insulin-independent GLUT4 translocation occurs via AMPK → TBC1D1 → Rab8a. Chronically: mitochondrial biogenesis increases CPT-1 capacity → lower steady-state DAG at rest.
Dietary carbohydrate quality and quantity improvement acts primarily through the ACC/malonyl-CoA/CPT-1/DAG chain: lower glycaemic load → lower postprandial insulin → lower ACC2 activity → CPT-1 de-inhibited → less esterification overflow → reduced plasma-membrane DAG.
Visceral fat loss restores adiponectin → AMPK → CPT-1 signalling and lowers inflammatory cytokines.
GLP-1 receptor agonists and tirzepatide improve sensitivity primarily via weight-loss-mediated visceral fat reduction and DAG/ceramide clearance, with additional direct hepatic and adipose effects ( GIP component in tirzepatide).
Very-low-calorie diets rapidly clear hepatic fat → plasma-membrane DAG falls → PKCε activity decreases → insulin receptor kinase activity is restored (hepatic-first sequence of remission).
Clinical Application
Insulin resistance is a medical condition. Everything in this entry is framed for educational understanding of mechanisms – to support informed client conversations and appropriate referral, not to inform any diagnostic or therapeutic protocol. The following notes apply specifically to the aesthetic practice context.
Recognising IR Risk in the Treatment Room
Practitioners are not diagnosing insulin resistance. However, the aesthetic consultation provides an opportunity to observe skin signs – acanthosis nigricans in characteristic locations, multiple soft skin tags, acne with hirsutism in women, or patterns of wound healing difficulty – that may warrant a gentle prompt toward GP assessment. The framing: “This is something worth mentioning to your GP – there are some metabolic screening tests that can be quite informative” – is appropriate, factual, and falls within the practitioner’s role as a health-aware professional without constituting clinical diagnosis.
Procedural Risk Stratification
Poorly controlled diabetes or significant IR with documented hyperglycaemia affects tissue repair capacity through the AGE, ROS, microvascular, and keratinocyte migration mechanisms described above. For barrier-disrupting procedures – fractional laser, RF microneedling, deep resurfacing – pre-treatment metabolic context is a legitimate consideration. The questions to explore: Is the client under active medical management for metabolic health? Has their glucose been reasonably controlled in the months preceding treatment? Are there other tissue repair risk factors present? These are clinical judgement calls informed by consultation, not exclusion criteria that can be applied as a checklist.
The Metabolic-to-Skin Narrative
The mechanistic chain connecting chronic metabolic dysregulation to observable skin consequences – barrier ceramide quality, collagen integrity, healing capacity, microbiome resilience – is now fully grounded across this entity cluster. For clients engaged with metabolic health interventions, particularly GLP-1-supported weight loss, the improving skin quality they often report is not coincidental and is mechanistically explainable: reduced DAG → reduced IR → normalising adiponectin → restored AMPK/CPT-1 → improved ceramide elongation substrate; reduced AGE formation → improved collagen cross-linking architecture; reduced systemic inflammation → reduced ELOVL3/6 suppression → longer acyl chain ceramides. None of this is a treatment claim – it is a mechanistic explanation for an observed correlation that clients frequently notice and ask about.
A further downstream consequence of the insulin resistance cycle not covered in the skin manifestations above operates through the circadian clock. The compensatory hyperinsulinaemia cycle – elevated insulin driving ACC, raising malonyl-CoA, inhibiting CPT-1, forcing esterification overflow – creates exactly the simultaneous high-glucose, high-lipid substrate environment that the Randle Cycle identifies as generating NADH accumulation and reducing the cellular NAD⁺/NADH ratio. Sustained reduction in the NAD⁺ pool depletes the cofactor supply that SIRT1 requires to maintain BMAL1 oscillation amplitude in skin cells, progressively dampening the circadian gating of ceramide synthesis, the collagen synthesis-assembly sequence, and DNA repair efficiency. This is not the same mechanism as the DAG/ceramide/inflammatory pathway – it operates in parallel, through a different molecular route, on the timing architecture of skin repair rather than its inflammatory environment. Clients with long-standing insulin resistance may be experiencing both simultaneously. The mechanism is developed in the Metabolic Chronodisruption entity.
The Insulin-Resistant Brain: What It Means for Cravings and GLP-1 Conversations
The skin consequences of insulin resistance are well-mapped above. The appetite consequences are less often discussed in the aesthetic context, but they are directly relevant to clients managing their metabolic health – particularly those using or considering GLP-1 medication.
In insulin-resistant individuals, the brain’s own hunger-control system becomes impaired through a distinct but related mechanism. The hypothalamus contains two primary populations of glucose-sensing neurons: POMC neurons (satiety, activated when glucose is adequate) and NPY/ AgRP neurons (hunger, activated when glucose falls and food-seeking is needed). Under normal conditions this system is precise. In high-fat, high-sugar dietary conditions, research in animal models has shown that hypothalamic GLUT2 expression is reduced and AMPK signalling becomes dysregulated, degrading the accuracy of these glucose-sensing neurons. [8] The practical consequence – described in a 2026 PLOS Medicine perspective by Professor David Ludwig – is a state in which the brain signals fuel deprivation despite adequate circulating and stored energy, because it cannot reliably sense or access either. [5] Fat stores are inaccessible (CPT-1 inhibited by chronically elevated malonyl-CoA), ketone production is suppressed by persistently elevated insulin, and hypothalamic glucose sensing is impaired. The hunger signal is neurologically real and physiologically driven; it is not a failure of self-regulation.
For clients on GLP-1 medication who report that appetite control feels effortless – and for those who report that cravings return when medication is reduced or stopped – the hypothalamic impairment mechanism provides the explanation. GLP-1 agonists reduce appetite through receptor-mediated satiety signalling that partially overrides the hunger neuron dysregulation. When medication is reduced or stopped, the underlying hypothalamic impairment remains, and the craving pattern re-emerges. The dietary framing that addresses this most directly is restoring metabolic flexibility and reducing the glycaemic load of lunch – addressing the fuel-switching failure, not solely the appetite signal.
Clinical Pearl Clients who describe their cravings as feeling “compulsive” or “irrational” – eating past fullness, a sense of loss of control specifically around high-GI foods – may be describing the hypothalamic dysregulation mechanism rather than habitual eating patterns. Framing this as a physiological signal rather than a behavioural weakness is accurate and, for most clients, genuinely useful.
References
Fang CEH, Crowe C, Murphy A, et al. (2020). Cross-sectional study of the association between skin tags and vascular risk factors in a bariatric clinic-based cohort of Irish adults with morbid obesity. BMC Res Notes, 13(1), 156 . doi.org/10.1186/s13104-020-05006-4
Gaspar RC, Lyu K, Hubbard BT, et al. (2023). Distinct subcellular localisation of intramyocellular lipids and reduced PKCε/PKCθ activity preserve muscle insulin sensitivity in exercise-trained mice. Diabetologia, 66(3), 567-578 . doi.org/10.1007/s00125-022-05838-8
Greene RK, Gangidi S, Zhao R, et al. (2024). The relationship between acrochordons, obesity, and metabolic syndrome in the pediatric population: A retrospective cohort study. Pediatr Dermatol, 41(4), 660-666 . doi.org/10.1111/pde.15639
Kahn D, Perreault L, Macias E, et al. (2021). Subcellular localisation and composition of intramuscular triacylglycerol influence insulin sensitivity in humans. Diabetologia, 64(1), 168-180 . doi.org/10.1007/s00125-020-05315-0
Ludwig DS (2026). Are ultra-processed foods too tasty? Toward a metabolic framework for diet and obesity. PLoS Med, 23(4), e1005025 . doi.org/10.1371/journal.pmed.1005025
Pavel P, Blunder S, Moosbrugger-Martinz V, et al. (2022). Atopic Dermatitis: The Fate of the Fat. Int J Mol Sci, 23(4) . doi.org/10.3390/ijms23042121
Videira-Silva A, Albuquerque C, Fonseca H (2019). Acanthosis nigricans as a clinical marker of insulin resistance among overweight adolescents. Ann Pediatr Endocrinol Metab, 24(2), 99-103 . doi.org/10.6065/apem.2019.24.2.99
Yoon NA, Diano S (2021). Hypothalamic glucose-sensing mechanisms. Diabetologia, 64(5), 985-993 . doi.org/10.1007/s00125-021-05395-6
Zhang Z, Jiang C, Xing YQ, et al. (2025). Unveiling the interplay among skin microbiota, cytokines, and T2DM: an insightful Mendelian randomization study. Nutr Metab (Lond), 22(1), 29 . doi.org/10.1186/s12986-025-00922-3
Learn More
This topic is discussed in 4 articles:
-
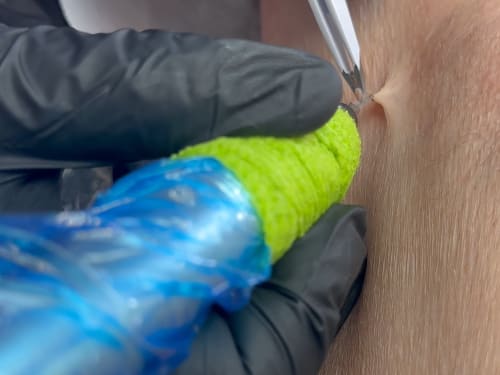
Not liking those pesky skin tags? Learn about causes, blemish removal options at Creative Touch, and prevention tips for smoother, bump-free skin.
-
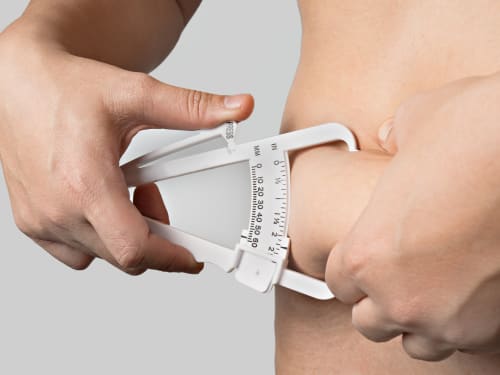
Understand what body composition really measures, why BMI is limited, and how waist‑to‑height ratio, body fat %, ABSI and BRI relate to health risk in UK adults.
-

While many patients experience positive weight loss results from Mounjaro injections, here’s what you should know about tiredness as a potential side effect of Mounjaro.
-

That sudden 4pm carb craving after a proper lunch isn’t a lack of willpower. It’s three biological systems colliding at exactly the wrong moment. Discover the metabolic science behind it and what actually helps.