
Insulin
Insulin is a 51 amino acid peptide hormone produced exclusively by the β-cells of the pancreatic islets of Langerhans, released in direct proportion to rising plasma glucose and amplified by gut-derived incretin hormones. It is co-secreted with C-peptide – a 31 amino acid connecting peptide long considered biologically inert but now recognised to carry independent vasoprotective and microcirculatory activity. Insulin’s metabolic actions operate through a receptor tyrosine kinase expressed on hepatocytes, myocytes, adipocytes, keratinocytes, sebocytes, and dermal fibroblasts; its two primary downstream signalling branches – PI3K/AKT (metabolic) and MAPK/ERK (proliferative) – are differentially susceptible to the lipotoxic impairment of insulin resistance, with consequences for both systemic metabolism and skin biology covered in the Insulin Resistance and Insulin Signalling entities. The distinction between insulin and glucose as independent variables in metabolic health is clinically underappreciated: compensatory hyperinsulinaemia precedes hyperglycaemia by years to decades, and the tissue consequences of chronically elevated insulin – IGF-1R cross-activation, androgen synthesis upregulation, and persistent lipogenic signalling – are mechanistically distinct from glucose-mediated damage.
Insulin governs the transition between the fasted and fed metabolic state – the hormonal signal that tells tissues glucose is available, storage should proceed, and fat oxidation should yield to glucose utilisation. Its discovery in 1921 by Banting, Best, Collip, and Macleod transformed type 1 diabetes from a fatal wasting disease to a manageable condition; its broader metabolic architecture, extending from the β-cell secretory mechanism to its effects on skin microcirculation via C-peptide, was established over the following century. Understanding insulin as a molecule – rather than simply as a blood glucose regulator – is essential for interpreting the metabolic cluster of entities this knowledge base develops.
Structure and Biosynthesis
Mature insulin is a 51 amino acid protein organised into two chains joined by disulfide bonds. The A chain contains 21 amino acids; the B chain contains 30 amino acids. Three disulfide bonds hold the structure together: two inter-chain bonds linking A7–B7 and A20–B19, and one intra-A-chain bond between A6 and A11. This disulfide architecture is essential to the hormone’s biological activity – reduction of the disulfide bonds abolishes receptor binding. [7]
Biosynthesis proceeds through a precise sequence in the β-cell rough ER and Golgi:
Preproinsulin (110 amino acids) is the initial translation product. A 24 amino acid signal peptide directs the nascent chain into the ER lumen and is co-translationally cleaved, yielding proinsulin (86 amino acids) – a single polypeptide chain in which the A and B chains are connected by a 31 amino acid C-peptide (connecting peptide). This single-chain arrangement allows the disulfide bonds to form correctly in the oxidising ER environment before the connecting peptide is removed.
Proinsulin is packaged into immature secretory granules in the trans-Golgi network. Within maturing dense-core granules, two prohormone convertases – PC1/3 and PC2 – cleave at dibasic sites flanking the C-peptide, releasing it alongside insulin. Carboxypeptidase E then trims the dibasic residues. The products stored in the mature granule are equimolar amounts of insulin and C-peptide, plus small amounts of intact proinsulin (normally <5% of total). In the mature granule, six insulin monomers coordinate around two zinc ions to form the hexameric storage form – compact, stable, and resistant to premature secretion. [2]
On exocytosis, the hexamer disperses into the portal circulation as biologically active monomers. Proinsulin itself has approximately 5% of insulin’s biological activity; disproportionately elevated fasting proinsulin is a marker of β-cell secretory stress and early dysfunction.
Secretion: The β-Cell Mechanism
Insulin secretion is triggered by a tightly regulated intracellular ATP-sensing mechanism in the β-cell, then amplified by nutrient and hormonal co-stimuli. The core mechanism: [11]
The KATP channel model: Glucose enters the β-cell via GLUT2 (the high-Km, high-capacity glucose transporter expressed on β-cells), is phosphorylated by glucokinase – the β-cell’s glucose sensor, chosen for its sigmoid kinetics matching physiological glucose concentrations – and enters glycolysis and the TCA cycle. Rising ATP/ADP ratio closes ATP-sensitive potassium channels (KATP channels: Kir6.2 + SUR1 subunits) → K⁺ accumulates intracellularly → plasma membrane depolarises → voltage-gated L-type Ca²⁺ channels open → cytosolic Ca²⁺ rises → triggers fusion of insulin secretory granules with the plasma membrane → exocytosis.
Biphasic secretion: Insulin secretion in response to a glucose stimulus is characteristically biphasic. The first phase (0–10 minutes) represents rapid exocytosis of pre-formed, docked granules located at the plasma membrane – a readily releasable pool that responds immediately to the Ca²⁺ signal. The second phase (10–60+ minutes) represents sustained secretion from a larger reserve pool, requiring granule mobilisation, transport to the membrane, and in part new synthesis.
First-phase insulin secretion blunting is one of the earliest measurable markers of β-cell dysfunction in the progression toward type 2 diabetes. A 2021 study (Journal of Clinical Investigation, 2021, PMC8203449) confirmed that reduced first-phase release precedes fasting hyperglycaemia by years in at-risk individuals, correlating with declining β-cell mass and increasing proinsulin/insulin ratio. The practical implication: an intravenous glucose tolerance test (IVGTT) or clamp study can detect first-phase blunting long before any abnormality appears on fasting glucose or HbA1c – a window for early intervention that standard clinical screening does not capture. [11]
Incretin amplification: The gut-derived hormones GLP-1 (glucagon-like peptide-1, from L-cells in the distal small intestine and colon) and GIP (glucose-dependent insulinotropic polypeptide, from K-cells in the proximal small intestine) are released in response to nutrient ingestion and act on their respective Gs-coupled receptors on β-cells to raise intracellular cAMP, activate PKA and EPAC2, enhance granule docking and Ca²⁺ sensitivity, and amplify glucose-stimulated insulin secretion. The incretins do not trigger secretion independently of glucose; their amplifying effect is strictly glucose-dependent, which is why GLP-1 receptor agonists do not cause hypoglycaemia as monotherapy. The incretin effect explains why the same glucose load administered orally produces a substantially greater insulin response than the same load administered intravenously – the gut sees the glucose first and primes the β-cell before the glucose reaches the portal circulation.
Additional secretagogues: Amino acids (particularly leucine and arginine), fatty acids acting via GPR40/FFAR1 on β-cells, parasympathetic innervation (acetylcholine via M3 receptors), and GLP-1/GIP all contribute to the postprandial insulin secretion amplitude. The integrated signal from a mixed meal is therefore substantially larger than the glucose-only response.
Metabolic Actions by Tissue
Insulin’s metabolic effects distribute across four primary target tissues with tissue-specific consequences that collectively define the fed-state metabolic programme: [8]
Liver – the central metabolic switch: Insulin acting on hepatic insulin receptors suppresses endogenous glucose production (EGP) via AKT2-mediated FOXO1 nuclear exclusion (reducing PEPCK and G6Pase transcription) and promotes glycogen synthesis via AKT2-mediated GSK3β inactivation. Simultaneously, insulin activates SREBP-1c transcription of lipogenic genes – ACC1, FAS, SCD1 – driving de novo lipogenesis from excess glucose-derived acetyl-CoA. Insulin also activates ACC2 at the outer mitochondrial membrane, raising hepatic malonyl-CoA and suppressing CPT-1 – the molecular mechanism by which the fed, insulin-elevated state switches the liver from fat oxidation to fat synthesis and storage. The malonyl-CoA/ CPT-1 axis connecting insulin to fuel switching is the subject of the Malonyl-CoA and CPT-1 entities.
Skeletal muscle – the primary glucose disposal site: Insulin drives GLUT4 translocation to the plasma membrane via AKT2 → TBC1D4 (AS160) phosphorylation → Rab-GTPase activation → vesicle fusion, enabling glucose uptake that accounts for approximately 80% of postprandial glucose disposal. Insulin simultaneously activates glycogen synthase (via GSK3β inhibition), promotes protein synthesis via mTORC1/S6K, and – via the same malonyl-CoA axis – suppresses muscle fat oxidation in favour of glucose utilisation.
Adipose tissue – the fuel reserve: Insulin’s anti-lipolytic action in adipocytes is mediated by AKT2 → PDE3B activation → cAMP hydrolysis → suppression of HSL and ATGL activity → reduced free fatty acid and glycerol release from triglyceride stores. When this arm is functioning normally, adipose tissue serves as a net fatty acid sink in the postprandial state. In insulin resistance, the anti-lipolytic arm is impaired – adipocytes continue releasing FFAs into the portal and systemic circulation even in the fed state, fuelling the ectopic lipid accumulation that drives further insulin resistance in liver and muscle.
The ACC/malonyl-CoA/fuel switching axis: Across all three metabolic tissues, insulin activates ACC (both ACC1 and ACC2 isoforms), raising malonyl-CoA. This simultaneously promotes de novo fatty acid synthesis (ACC1 → FAS) and inhibits CPT-1-mediated fatty acid oxidation (ACC2 → mitochondrial outer membrane malonyl-CoA pool). Insulin is therefore not simply a glucose-lowering hormone – it is the primary coordinator of the glucose-preferring fuel state in all metabolic tissues, acting through the malonyl-CoA molecular switch discussed in the Malonyl-CoA entity.
Insulin in Skin
The skin expresses insulin receptors on multiple cell populations, and insulin has direct – not merely systemic – effects on epidermal and dermal biology. The isoform distribution and signalling consequences in skin differ meaningfully from the canonical metabolic tissues.
Receptor isoform expression in skin: A study by Beneit et al. (Cardiovascular Diabetology, 2016) characterised insulin receptor isoform expression directly in human keratinocytes and melanocytes. Both IR-A and IR-B are expressed in normal human keratinocytes, alongside IGF-1R and IR/IGF-1R hybrid receptors. The co-expression of all four receptor species means that keratinocytes receive and integrate signals from both insulin and IGF-1 through overlapping but distinct signalling architectures. IR-A (which binds insulin with normal affinity but also binds IGF-2, and signals more strongly through the MAPK/ERK proliferative branch) is expressed alongside IR-B (the canonical metabolic isoform), suggesting that keratinocyte insulin responses encompass both metabolic and proliferative downstream effects. [1]
Keratinocyte function: IRS-1 (the primary insulin receptor substrate) plays a specific role in normal keratinocyte differentiation that is independent of its metabolic role in muscle and liver. A study by Sadagurski et al. (Journal of Cellular Physiology, 2007) found that IRS-1 expression in keratinocytes regulated the differentiation programme via the PI3K/AKT pathway, with IRS-1 deficiency producing impaired differentiation and barrier organisation. Normal physiological insulin signalling through IRS-1 in keratinocytes therefore supports the structural organisation of the epidermis – a function that is distinct from glucose disposal and is impaired when IRS-1 is chronically serine-phosphorylated in the insulin-resistant state. [10]
Sebocytes: Insulin receptors are expressed on sebaceous gland sebocytes, where insulin promotes lipogenesis and sebum production. At physiological concentrations, this is part of normal sebaceous gland function; at hyperinsulinaemic concentrations, the combination of direct sebocyte stimulation and androgen upregulation via the CYP17A1 mechanism (detailed in the Insulin Resistance entity’s PCOS section) drives excess sebum production. The sebocyte androgen-insulin interaction is the mechanistic basis of the association between high-glycaemic dietary patterns, hyperinsulinaemia, and acne severity – a relationship with a reasonably consistent evidence base across dietary intervention studies.
Dermal fibroblasts: Insulin signalling in dermal fibroblasts promotes collagen synthesis and fibroblast proliferation, contributing to normal dermal structure and wound healing. Fibroblast insulin receptor expression ensures that the dermis responds to the anabolic fed state – accelerating repair and matrix production when energy and nutrient availability are signalled as adequate.
Vasodilation and the eNOS pathway: Insulin stimulates nitric oxide (NO) production in vascular endothelium via the PI3K/AKT → eNOS (endothelial nitric oxide synthase) phosphorylation axis, producing vasodilation in dermal microvasculature. This is a physiologically important route for directing blood flow to metabolically active tissue in the postprandial state. In insulin resistance, the PI3K/AKT arm is impaired whilst the MAPK/ERK arm – which activates the vasoconstrictor endothelin-1 (ET-1) in endothelium – remains relatively preserved. The result is a shift toward net vasoconstriction in dermal and systemic microvasculature, contributing to the microvascular dysfunction of metabolic syndrome and impairing the tissue perfusion that wound healing requires. [6]
C-Peptide: The Overlooked Co-Secreted Molecule
C-peptide was long treated as a biologically inert cleavage product – useful clinically only as a proxy for endogenous insulin secretion (because, unlike insulin, it is not extracted by the liver and has a longer half-life of 20–30 minutes). The past two decades have substantially revised this view. [5]
Independent biological activity: C-peptide has been shown to bind to cell membranes via a Gi-coupled receptor interaction and to activate intracellular signalling pathways including PI3K, MAPK, and eNOS. The proposed receptor is GPR146, an orphan G-protein-coupled receptor. However, the GPR146/C-peptide interaction remains contested: the original 2013 interaction study (Yosten et al., PMID 23759446) reported the interaction, but a 2019 re-evaluation and a 2025 review (An Orphan Under Pressure, PMC12356492) noted that the binding evidence is not fully replicated and that GPR146’s pharmacology has not been confirmed to mediate the established physiological effects of C-peptide. The biological activity of C-peptide is better established than its specific receptor. [12] [9]
Microvascular effects – direct skin relevance: A 1998 study directly demonstrated that topical application of C-peptide to forearm skin in individuals with type 1 diabetes – who have virtually no endogenous C-peptide, since their β-cells are destroyed – significantly increased skin blood flow by laser Doppler flowmetry, an effect not observed with saline control or with insulin alone. A subsequent series of studies (including PMC2491698) established that C-peptide stimulates eNOS in endothelial cells and activates Na⁺/K⁺-ATPase in smooth muscle, producing vasodilation through mechanisms partially overlapping with, but distinct from, insulin’s eNOS pathway. [4]
Clinical implication of absent C-peptide in type 1 diabetes: Individuals with type 1 diabetes replace insulin with subcutaneous injections but receive no C-peptide. The microvascular complications of T1DM – retinopathy, nephropathy, neuropathy, and impaired skin microcirculation – have been hypothesised to be partly attributable to C-peptide deficiency rather than solely to glycaemic control. Randomised trials of C-peptide replacement in T1DM have shown modest improvements in peripheral nerve function and glomerular filtration, though results have been inconsistent and C-peptide is not an approved therapeutic agent. The field remains active but not clinically established. This is noted for mechanistic completeness; C-peptide replacement is not a current therapeutic option outside research settings.
The C-peptide/insulin ratio as a clinical signal: Because C-peptide and insulin are co-secreted equimolarly but C-peptide is not extracted by the liver, a disproportionately elevated fasting insulin relative to C-peptide (low C-peptide:insulin ratio) suggests exogenous insulin administration or hepatic insulin clearance impairment. Conversely, elevated C-peptide with normal or elevated insulin is consistent with endogenous compensatory hypersecretion – the signature of insulin resistance. Fasting C-peptide measurement is underutilised clinically for this reason.
Clearance, Half-Life, and the Hepatic First-Pass Problem
Endogenous insulin has a plasma half-life of approximately 4–6 minutes in peripheral blood, reflecting rapid hepatic and renal clearance. The hepatic extraction fraction is approximately 50% on first pass through the portal circulation – meaning that roughly half of all insulin secreted by the pancreas is extracted and inactivated by the liver before it reaches the systemic circulation. This is physiologically appropriate: the liver is the primary target of portal insulin’s anti-gluconeogenic effects, and local portal insulin concentrations are substantially higher than systemic concentrations. [3]
The subcutaneous insulin problem: All current insulin therapy – whether rapid-acting analogues (lispro, aspart, glulisine), long-acting analogues (glargine, detemir, degludec), or biosimilar human insulins – is administered subcutaneously or intravenously, not portally. Subcutaneous insulin enters the systemic peripheral circulation first, bypassing the hepatic first-pass extraction. The liver sees the same insulin concentration as peripheral tissues, rather than the 2–3 fold higher portal concentration it would receive from endogenous secretion. [3]
The functional consequences: peripheral tissues (muscle, adipose, skin) are exposed to higher insulin concentrations relative to what the liver receives, compared with endogenous secretion. This reversal of the normal portal-to-peripheral gradient is a pharmacological reality of all subcutaneous insulin delivery that cannot be fully compensated by dosing adjustments. It is one mechanistic basis for the peripheral hyperinsulinaemia sometimes observed in intensively insulin-treated type 1 diabetes, and a theoretical contributor to the cardiovascular and proliferative consequences of IGF-1R cross-activation in peripheral tissues. [3]
C-peptide’s longer half-life (20–30 minutes) and absence of significant hepatic extraction make it a more reliable endogenous insulin secretion proxy in clinical and research settings than insulin itself – another reason fasting C-peptide is often more informative than fasting insulin in characterising β-cell function and reserve.
Hyperinsulinaemia: Distinct from Hyperglycaemia
One of the most clinically underappreciated aspects of insulin biology is that elevated insulin and elevated glucose are separate variables, with different tissue consequences, operating on different timescales in the progression toward type 2 diabetes. In the early and middle stages of insulin resistance, the pancreatic β-cell maintains normoglycaemia through compensatory hypersecretion – a client can have fasting glucose of 4.8 mmol/L, a completely normal HbA1c, and a fasting insulin of 25+ μIU/mL with substantial ongoing tissue exposure to supraphysiological insulin concentrations. Standard clinical screening will report no abnormality. [2]
The tissue consequences of chronic hyperinsulinaemia that are independent of glycaemia include:
- IGF-1R cross-activation: At supraphysiological concentrations, insulin’s affinity for IGF-1R becomes physiologically relevant, driving keratinocyte and fibroblast proliferation – the acanthosis nigricans mechanism detailed in the Insulin Resistance entity
- IGFBP-1 suppression: Insulin potently suppresses hepatic IGFBP-1 synthesis, raising free circulating IGF-1 and amplifying IGF-1R activation in peripheral tissues
- Androgen synthesis upregulation: Via CYP17A1 stimulation in ovarian theca cells – the PCOS/acne/ androgenetic alopecia pathway (Insulin Resistance entity)
- Persistent lipogenic signalling: Elevated insulin keeps SREBP-1c active and ACC expression elevated, maintaining malonyl-CoA at levels that chronically suppress CPT-1 even when the client is not actively eating
- mTORC1 activation and negative feedback on IRS-1: Chronically elevated insulin drives mTORC1/S6K1, which serine-phosphorylates IRS-1 and progressively degrades the PI3K/AKT signalling capacity – a self-limiting mechanism that, when chronically engaged, contributes to the PI3K/AKT arm’s selective impairment in insulin resistance
These consequences operate at insulin concentrations that do not elevate glucose because the glucose-disposal arm – muscle GLUT4 translocation – is still partially operational in early IR. Hyperinsulinaemia and hyperglycaemia are therefore not synonymous: one precedes the other, and the tissue damage profile of each is partially distinct.
Clinical Application
Insulin is a medical topic, and its management in diagnosed diabetes or endocrine conditions is entirely within the remit of the client’s clinical care team. The following applies to the aesthetic practice context specifically.
Fasting Insulin as an Underused Screening Prompt
The gap between what standard NHS metabolic screening detects (HbA1c, fasting glucose) and what fasting insulin would reveal (compensatory hyperinsulinaemia in early IR) is clinically meaningful. A client presenting with acanthosis nigricans, multiple skin tags, treatment-resistant acne with irregular cycles, or unexplained seborrhoea who has been told their blood sugar is “normal” has not been screened for hyperinsulinaemia. This is not within the aesthetic practitioner’s scope to investigate directly – but it is a reasonable prompt to raise with the client: “It might be worth asking your GP for a fasting insulin level alongside your glucose, as they tell different stories in the early stages of metabolic changes.” That is an informed, evidence-based, and appropriately scoped clinical conversation.
C-Peptide and Post-Procedure Skin Perfusion
The C-peptide microvascular evidence is most directly relevant to clients with type 1 diabetes, who have virtually no endogenous C-peptide and may have impaired skin microcirculation independent of glycaemic control. For barrier-disrupting procedures, the tissue perfusion context in T1DM clients is worth considering – not as a contraindication but as a factor in the recovery expectation conversation. Well-controlled T1DM with good HbA1c does not exclude the microvascular effects of C-peptide absence. This warrants a conservative approach to aggressive resurfacing and careful post-procedure monitoring of healing trajectory.
The Insulin-Skin Narrative for Client Education
For clients engaged with metabolic health – particularly those on GLP-1 receptor agonists or structured dietary programmes – the insulin/skin connection provides a mechanistically grounded explanation for skin changes they may observe as insulin levels normalise. Falling hyperinsulinaemia → reduced IGF-1R cross-activation → reduced keratinocyte hyperproliferation → softer AN features; reduced androgen upregulation → improved sebum regulation; restored eNOS/vasodilation balance → improved dermal perfusion. These are plausible mechanistic directions, not guaranteed outcomes, and should be framed accordingly.
Scope Note
Insulin dosing, injection technique, glucose management protocols, and diabetes treatment decisions are outside aesthetic scope of practice. For clients on insulin therapy, any question relating to their insulin regimen should be directed to their diabetes care team. This entity provides mechanistic understanding; it does not constitute clinical guidance.
References
Beneit N, Fernández-García CE, Martín-Ventura JL, et al. (2016). Expression of insulin receptor (IR) A and B isoforms, IGF-IR, and IR/IGF-IR hybrid receptors in vascular smooth muscle cells and their role in cell migration in atherosclerosis. Cardiovasc Diabetol, 15(1), 161 . doi.org/10.1186/s12933-016-0477-3
Dludla PV, Mabhida SE, Ziqubu K, et al. (2023). Pancreatic β-cell dysfunction in type 2 diabetes: Implications of inflammation and oxidative stress. World J Diabetes, 14(3), 130-146 . doi.org/10.4239/wjd.v14.i3.130
Edgerton DS, Moore MC, Gregory JM, et al. (2021). Importance of the route of insulin delivery to its control of glucose metabolism. Am J Physiol Endocrinol Metab, 320(5), E891-E897 . doi.org/10.1152/ajpendo.00628.2020
Forst T, Kunt T, Pohlmann T, et al. (1998). Biological activity of C-peptide on the skin microcirculation in patients with insulin-dependent diabetes mellitus. J Clin Invest, 101(10), 2036-41 . doi.org/10.1172/jci2147
Forst T, Kunt T, Wilhelm B, et al. (2008). Role of C-Peptide in the regulation of microvascular blood flow. Exp Diabetes Res, 2008, 176245 . doi.org/10.1155/2008/176245
Fu J, Yu MG, Li Q, et al. (2021). Insulin’s actions on vascular tissues: Physiological effects and pathophysiological contributions to vascular complications of diabetes. Mol Metab, 52, 101236 . doi.org/10.1016/j.molmet.2021.101236
Khin Phyu Phyu, Lee Jong Han, Jun Hee-Sook (2023). Pancreatic Beta-cell Dysfunction in Type 2 Diabetes. European Journal of Inflammation, 21 . doi.org/10.1177/1721727x231154152
Le TKC, Dao XD, Nguyen DV, et al. (2023). Insulin signaling and its application. Front Endocrinol (Lausanne), 14, 1226655 . doi.org/10.3389/fendo.2023.1226655
Pernomian L, Parente JM, McCarthy CG, et al. (2025). Orphan Under Pressure: GPR146 as a Mechanotransduction Modulator. Circ Res, 137(5), 625-627 . doi.org/10.1161/circresaha.125.327056
Sadagurski M, Nofech-Mozes S, Weingarten G, et al. (2007). Insulin receptor substrate 1 (IRS-1) plays a unique role in normal epidermal physiology. J Cell Physiol, 213(2), 519-27 . doi.org/10.1002/jcp.21131
Weir GC, Bonner-Weir S (2021). Reduced glucose-induced first-phase insulin release is a danger signal that predicts diabetes. J Clin Invest, 131(12) . doi.org/10.1172/jci150022
Yosten GL, Kolar GR, Redlinger LJ, et al. (2013). Evidence for an interaction between proinsulin C-peptide and GPR146. J Endocrinol, 218(2), B1-8 . doi.org/10.1530/joe-13-0203
Biological Relationships
Influenced By
- this Inhibited by Adipocyte Evidence: Adipocyte TNF-alpha/IL-6 secretion impairs insulin signalling; adiponectin decline removes insulin-sensitising signal. Gao 2025; Ellulu 2016.
Learn More
This topic is discussed in 6 articles:
-

That sudden 4pm carb craving after a proper lunch isn’t a lack of willpower. It’s three biological systems colliding at exactly the wrong moment. Discover the metabolic science behind it and what actually helps.
-

While many patients experience positive weight loss results from Mounjaro injections, here’s what you should know about tiredness as a potential side effect of Mounjaro.
-
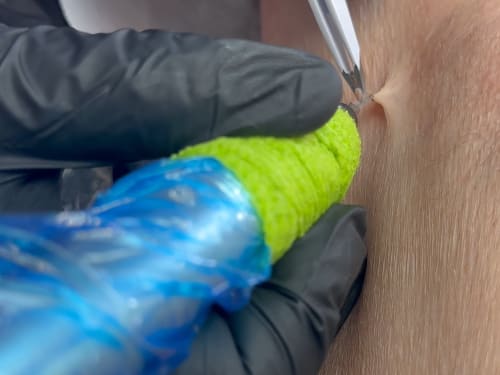
Not liking those pesky skin tags? Learn about causes, blemish removal options at Creative Touch, and prevention tips for smoother, bump-free skin.
-

Experiencing hair loss on Mounjaro? Discover why it happens, plus evidence-based prevention strategies, and treatment options. Most cases are temporary and reversible.
-

If you’re using Mounjaro medication, you may be wondering whether your choice of injection site matters. We take a look at the clinical trial results that suggests it can.
-

If you can’t stop thinking about food, it might not be addiction. Discover why chronic dieting and restriction create a biological backlash, and how to fix it.